
Fig. 1
- ID
- ZDB-IMAGE-240903-63
- Publication
- Harboe et al., 2024 - The metalloproteinase PAPP-A is required for IGF-dependent chondrocyte differentiation and organization
- All Figures
- Figures for Harboe et al., 2024
|
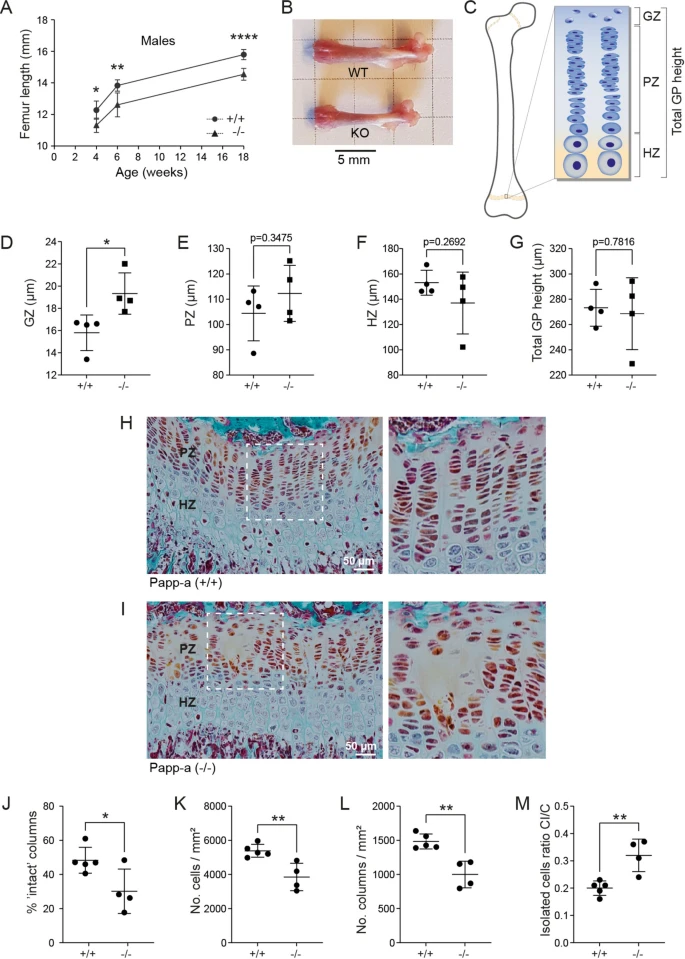
Fig. 1 PAPP-A knockout in mice causes reduced bone length and growth plate chondrocyte disorganization. (A) Femoral bone length in male wild-type and knockout mice at postnatal week 4, 6 and 18. The number of mice (wild-types/knockouts males): 4 weeks, (5/5); 6 weeks (6/6); 18 weeks, (10/5). (B) Representative examples of intact femurs from wild-type or knockout PAPP-A mice at 6 weeks of age. (C) Schematic drawing indicating the positions of the growth plate germinal zone (GZ), the proliferative zone (PZ), the hypertrophic zone (HZ), and the total growth plate (GP) height. (D–G) Heights of the GZ (D), the PZ (E), the HZ (F), and the total growth plate height (G) was measured on growth plate sections stained with Masson–Goldner trichrome from 4 weeks old male Pappa wild-type (+/+) and knockout (−/−) mice. The data are based on 4 wild-type and 4 knockout mice. (H–I) Representative examples of growth plates sections from 4 weeks old male Pappa wild-type (+ / +) and knockout (−/−) mice, respectively. The boxed areas of the proliferative zone are shown at a higher magnification to the right. Note that the proliferative zone of the PAPP-A knockout shows areas devoid of chondrocytes. (J–M) Quantification of growth plate columnar organization using grid-based analysis31. The data are based on 5 wild-type and 4 knockout mice. (J) The percentage of intact columns, i.e. columns with chondrocytes continuously across the full height of the proliferative zone. (K) Cell density in the proliferative zone. (L) Column density in the proliferative zone. (M) Isolated cells ratio (CI/C), reported as the proportion of isolated cells (CI) per grid field among the total cell number (C) within a grid field (increased by 60% in Pappa knockout compared to wild-type mice). This parameter describes the quality of columnar arrangement, with a high CI/C ratio indicating a high proportion of chondrocytes not organized into columns31. Data are mean ± SD and are analyzed by unpaired two-tailed Student’s t-test. ns, p > 0.05; * p < 0.05; ** p < 0.01; *** p < 0.001; **** p < 0.0001.