FIGURE SUMMARY
Title

Peds1 deficiency in zebrafish results in myeloid cell apoptosis and exacerbated inflammation

Authors
Arroyo, A.B., Tyrkalska, S.D., Bastida-Martínez, E., Monera-Girona, A.J., Cantón-Sandoval, J., Bernal-Carrión, M., García-Moreno, D., Elías-Arnanz, M., Mulero, V.
Source
Full text @ Cell Death Discov

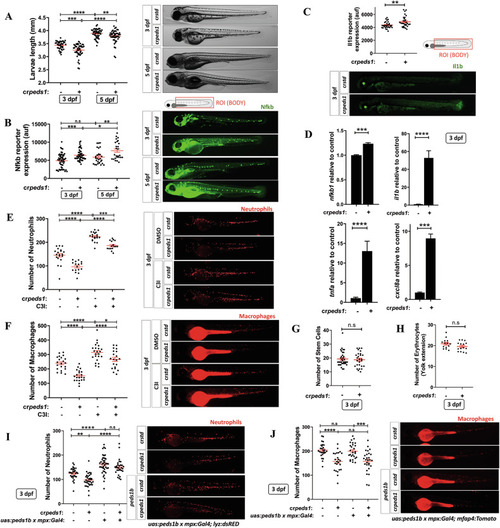
Peds1 deficiency promotes a proinflammatory stage with increased neutrophil and macrophage apoptosis.

One-cell stage zebrafish eggs were microinjected with std or peds1 crRNA/Cas9 complexes and the following parameters were evaluated: (A) Larval length and representative images (brightfield channel) at 3- and 5 dpf, (B) Nfkb fluorescent reporter expression levels and representative images (green channel; Tg(NFkB-RE:eGFP)) at 3 and 5 dpf analyzed by fluorescence microscopy, (C) Il1b fluorescent reporter expression levels and representative images (green channel; Tg(il1b:GFP-F)ump3) at 3 dpf analyzed by fluorescence microscopy. D Transcript levels of the indicated genes analyzed at 3 dpf by RT-qPCR. E, F Number of neutrophils and macrophages and representative images of microinjected larvae after 48 h of treatment with caspase 3 inhibitor (C3I) or vehicle (DMSO) were quantitated by fluorescence microscopy (red channel; Tg(lyz:DsRED2) and Tg(mfap4.1:Tomato), respectively). G, H Hematopoietic stem and progenitor cells (green channel; Tg(-6.0itga2b:eGFP)) and erythrocytes (red channel: Tg(gata1a:dsRED)) number were quantitated by fluorescence microscopy. I, J Number of neutrophils and macrophages and representative images of larvae microinjected to specifically express peds1 in neutrophils using the neutrophil-specific myeloperoxidase (mpx) promoter and analyzed by fluorescence microscopy. Each point represents one larva and the mean ± SEM of each group is also shown. P-values were calculated using one-way ANOVA Tukey’s and multiple range or unpaired Student’s t-test. n.s, not significant, *p ≤ 0.05, **p ≤ 0.01, ***p ≤ 0.001, ****p ≤ 0.001. auf arbitrary units of fluorescence.

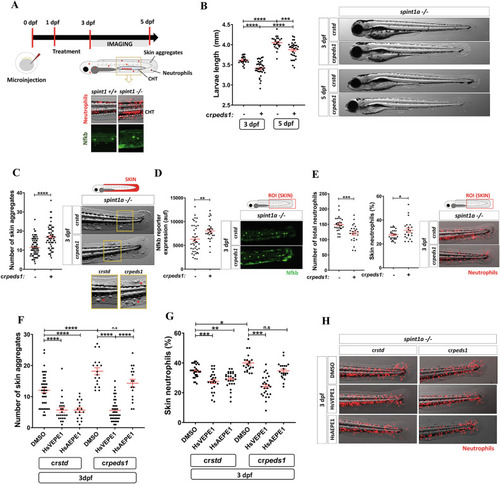
Peds1 deficiency exacerbates chronic skin inflammation.

A Schematic of the experimental procedure used for chronic skin inflammation assays. Spint1a-deficient one-cell stage eggs were microinjected with std or peds1 crRNA/Cas9 complexes and imaged at 3 and 5 dpf. Treatments of interest were added to dechorionated embryos at 1 dpf by bath immersion and renewed daily. Spint1a-deficient larvae showed chronic skin inflammation with increased skin neutrophil infiltration, Nfkb fluorescent reporter expression levels and keratinocyte aggregates. B Analysis and representative images (brightfield channel) of larval length at 3 and 5 dpf. C Number of keratinocyte aggregates in the skin (red arrows) and representative images (brightfield channel) at 3 dpf. D Analysis and representative images of Nfkb fluorescent reporter expression levels (green channel; Tg(NFkB-RE:eGFP)sh235) at 3 dpf by fluorescence microscopy. E Total number and percentage of neutrophils in the skin and representative merge images (brightfield and red channel; Tg(lyz:DsRED2)nz50) quantitated by fluorescence microscopy. F Number of skin aggregates and (G) percentage of skin neutrophils quantitated in crstd and crpeds1 spint1a-/- larvae treated for 48 h with 20 µM HsVEPE1, 20 µM HsAEPE1 or vehicle (DMSO). H Representative merge images (brightfield and red channel; Tg(lyz:DsRED2)nz50) of each treatment analyzed in (F) and (G) by microscopy fluorescence are shown. Each point represents one larva and the mean ± SEM of each group is also shown. P-values were calculated using one-way ANOVA and Tukey’s multiple range or unpaired Student’s t-test, as appropriate. n.s, not significant, *p ≤ 0.05, **p ≤ 0.01, ***p ≤ 0.001, ****p ≤ 0.001. auf arbitrary units of fluorescence.

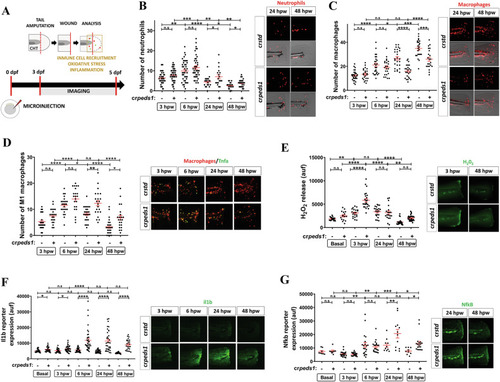
Peds1 deficiency impairs inflammation resolution and causes aberrant immune cells recruitment in a sterile tail injury model.

A Schematic of the experimental procedure used for tail injury assays. One-cell stage zebrafish eggs were microinjected with std or peds1 crRNA/Cas9 complexes. At 3 dpf larvae were tail amputated and then inflammation and immune cell recruitment at the injury site (dotted lines) were analyzed at 3, 6, 24 and 48 h post-wounding (hpw) by fluorescence microscopy. The wound area is defined as the region between the amputation edge and the end of the caudal hematopoietic tissue (CHT). B, C Number of neutrophil and macrophages recruited at the injury site and representative merge images (brightfield and red channel; Tg(lyz:DsRED2)nz50 and Tg(mfap4.1:Tomato)xt12, respectively). D Number of M1-like macrophages (Tnfa+) recruited at the injury site and representative merge images (red channel: Tg(mfap4.1:Tomato)xt12 and green channel: Tg(tnfa:eGFP-F)ump5). E Analysis of H2O2 release at the wound site using the fluorogenic substrate acetyl-pentafluor-obenzene sulphonyl fluorescein. EG Analysis and representative images of Il1b (green channel; Tg(il1b:GFP-F)ump3) and Nfkb fluorescent reporter expression levels (green channel; Tg(NFkB-RE:eGFP)sh235) at the wound site. Each point represents one larva and the mean ± SEM of each group is also shown. P-values were calculated using one-way ANOVA and Tukey’s multiple range. n.s, not significant, *p ≤ 0.05, **p ≤ 0.01, ***p ≤ 0.001, ****p ≤ 0.001. auf arbitrary units of fluorescence.

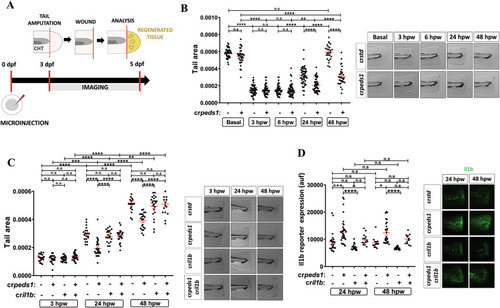
Peds1 deficiency hampers tissue regeneration.

A Schematic of the experimental procedure used for tail injury and regeneration assays. Three dpf larvae previously microinjected with std or peds1 crRNA/Cas9 complexes alone or in combination with cril1b were tail fin amputated and regeneration was evaluated by measuring regenerated fin areas up to 5 dpf (yellow). B, C Measurement of regenerated fin areas and representative images (brightfield channel). D Analysis and representative images of Il1b fluorescent reporter expression levels (green channel; Tg(il1b:GFP-F)ump3) by microscopy fluorescence. Each point represents one larva and the mean ± SEM of each group is also shown. P-values were calculated using one-way ANOVA and Tukey’s multiple range. n.s, not significant, *p ≤ 0.05, **p ≤ 0.01, ***p ≤ 0.001, ****p ≤ 0.001. auf arbitrary units of fluorescence.

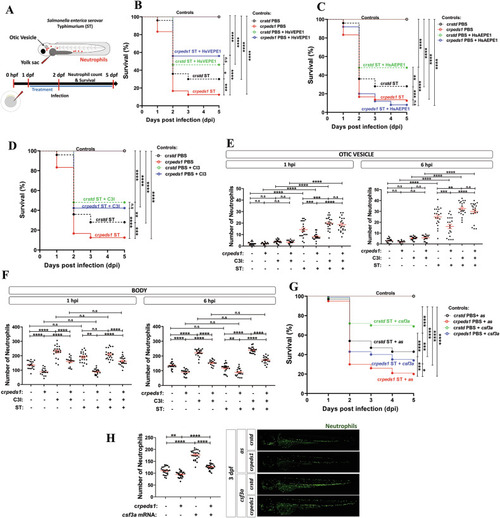
Peds1 deficiency increased susceptibility to bacterial infection.

A Schematic of the experimental procedure used for infection assays. Single-cell zebrafish embryos microinjected with std or peds1 crRNA/Cas9 complexes were dechorionated and infected at 2 dpf through either the otic vesicle (neutrophil recruitment) or yolk sac (larval survival) with Salmonella enterica serovar Thyphimurium (ST). Treatments of interest were added daily from 1 dpf by immersion and the number of surviving larvae was counted daily for the next 5 days. B Survival analysis of crstd and crpeds1 larvae infected with ST and treated with 20 µM HsVEPE1 or vehicle (DMSO). C Survival analysis of crstd and crpeds1 larvae infected with ST and treated with 20 µM HsAEPE1 or vehicle (DMSO). D Survival analysis of crstd and crpeds1 larvae infected with ST and treated with caspase 3 inhibitor (C3I, 50 µM) or vehicle (DMSO). E, F Number of neutrophil in the otic vesicle and body at 1 and 6 h post-infection in crstd and crpeds1 larvae treated with 50 µM C3I or vehicle (DMSO) counted by fluorescence microscopy (red channel; Tg(lyz:DsRED2)nz50). G Survival analysis of crstd and crpeds1 larvae injected in combination with antisense (As) or csf3a mRNA and infected with ST. H Number of neutrophil in whole body in uninfected crstd and crpeds1 larvae of 3 dpf treated with 50 µM C3I or vehicle (DMSO) counted by fluorescence microscopy (green channel; (mpx:eGFP)i114). BD and G A log-rank test was used to calculate the statistical differences in the survival of the different experimental groups. E, F Each point represents one larva and the mean ± SEM of each group is also shown. P-values were calculated using one-way ANOVA and Tukey’s multiple range. n.s not significant, *p ≤ 0.05, **p ≤ 0.01, ***p ≤ 0.001, ****p ≤ 0.001.

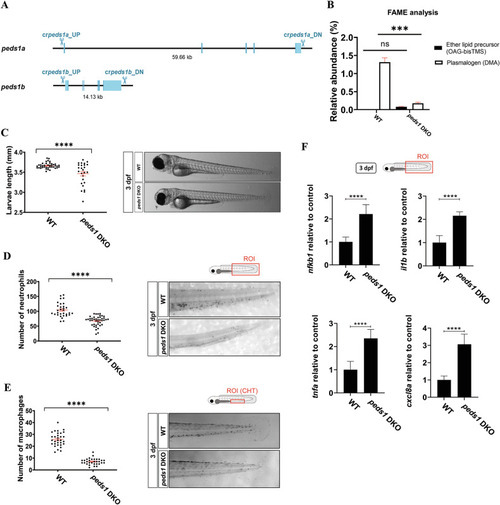
Peds1a/b DKO line shows developmental delay, neutropenia, monocytopenia and exacerbated inflammation.

A Generation of a DKO line by whole deletion of peds1a and peds1b genes using CRISPR-Cas9. BF Total plasmalogen and precursor quantification (B), larval length (C), number of neutrophil (D) and macrophage (E), and transcript levels of nfkb1, il1b, tnfa and clxcl8a genes, assayed by RT-qPCR (F). Each point represents one larva and the mean ± SEM of each group is also shown. *p ≤ 0.05, **p ≤ 0.01, ***p ≤ 0.001. ROI region of interest, CHT caudal hematopoietic tissue.

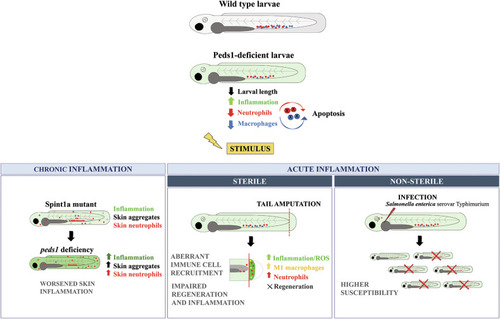
Model showing the effect of inhibiting plasmalogen synthesis under basal and different inflammatory conditions.

Inhibition of plasmalogen synthesis promotes a proinflammatory stage with increased neutrophil and macrophage apoptosis. Plasmalogen deficiency also exacerbates chronic skin inflammation, impairs inflammation resolution and tissue regeneration, and results in increased susceptibility to infection.

Acknowledgments
This image is the copyrighted work of the attributed author or publisher, and ZFIN has permission only to display this image to its users. Additional permissions should be obtained from the applicable author or publisher of the image. Full text @ Cell Death Discov