IMAGE

Fig. 6

ID
ZDB-IMAGE-240902-44
Source
Figures for Arroyo et al., 2024
Image
Figure Caption

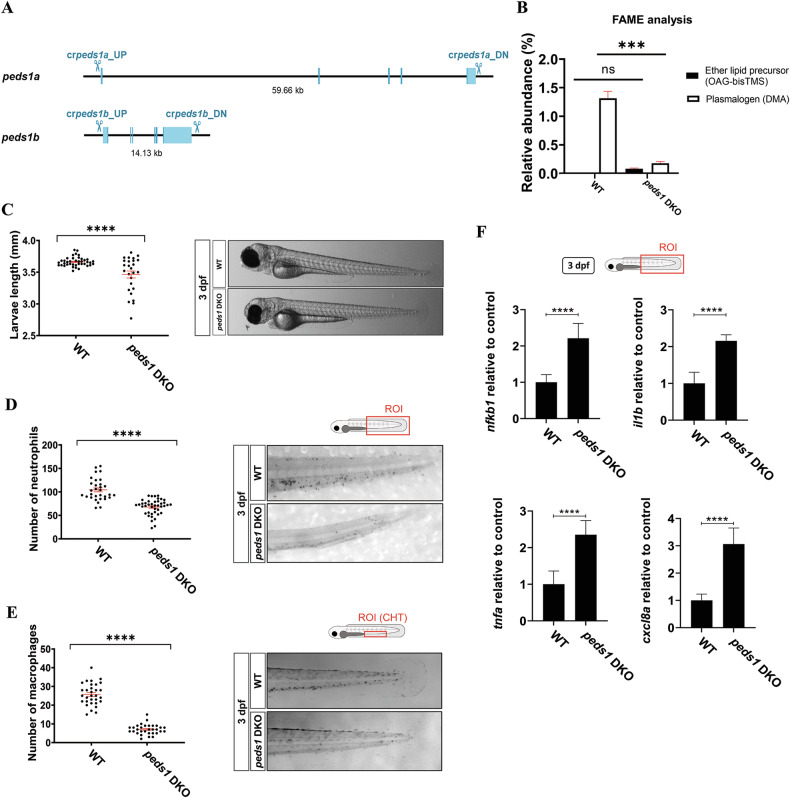
Fig. 6 Peds1a/b DKO line shows developmental delay, neutropenia, monocytopenia and exacerbated inflammation.

A Generation of a DKO line by whole deletion of peds1a and peds1b genes using CRISPR-Cas9. BF Total plasmalogen and precursor quantification (B), larval length (C), number of neutrophil (D) and macrophage (E), and transcript levels of nfkb1, il1b, tnfa and clxcl8a genes, assayed by RT-qPCR (F). Each point represents one larva and the mean ± SEM of each group is also shown. *p ≤ 0.05, **p ≤ 0.01, ***p ≤ 0.001. ROI region of interest, CHT caudal hematopoietic tissue.

Acknowledgments
This image is the copyrighted work of the attributed author or publisher, and ZFIN has permission only to display this image to its users. Additional permissions should be obtained from the applicable author or publisher of the image. Full text @ Cell Death Discov