|
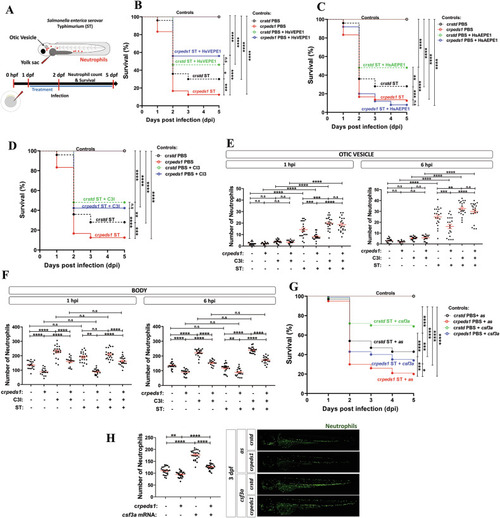
Peds1 deficiency increased susceptibility to bacterial infection. A Schematic of the experimental procedure used for infection assays. Single-cell zebrafish embryos microinjected with std or peds1 crRNA/Cas9 complexes were dechorionated and infected at 2 dpf through either the otic vesicle (neutrophil recruitment) or yolk sac (larval survival) with Salmonella enterica serovar Thyphimurium (ST). Treatments of interest were added daily from 1 dpf by immersion and the number of surviving larvae was counted daily for the next 5 days. B Survival analysis of crstd and crpeds1 larvae infected with ST and treated with 20 µM HsVEPE1 or vehicle (DMSO). C Survival analysis of crstd and crpeds1 larvae infected with ST and treated with 20 µM HsAEPE1 or vehicle (DMSO). D Survival analysis of crstd and crpeds1 larvae infected with ST and treated with caspase 3 inhibitor (C3I, 50 µM) or vehicle (DMSO). E, F Number of neutrophil in the otic vesicle and body at 1 and 6 h post-infection in crstd and crpeds1 larvae treated with 50 µM C3I or vehicle (DMSO) counted by fluorescence microscopy (red channel; Tg(lyz:DsRED2)nz50). G Survival analysis of crstd and crpeds1 larvae injected in combination with antisense (As) or csf3a mRNA and infected with ST. H Number of neutrophil in whole body in uninfected crstd and crpeds1 larvae of 3 dpf treated with 50 µM C3I or vehicle (DMSO) counted by fluorescence microscopy (green channel; (mpx:eGFP)i114). B–D and G A log-rank test was used to calculate the statistical differences in the survival of the different experimental groups. E, F Each point represents one larva and the mean ± SEM of each group is also shown. P-values were calculated using one-way ANOVA and Tukey’s multiple range. n.s not significant, *p ≤ 0.05, **p ≤ 0.01, ***p ≤ 0.001, ****p ≤ 0.001.
|