
- Title
-
Transdifferentiation is temporally uncoupled from progenitor pool expansion during hair cell regeneration in the zebrafish inner ear
- Authors
- Beaulieu, M.O., Thomas, E.D., Raible, D.W.
- Source
- Full text @ Development
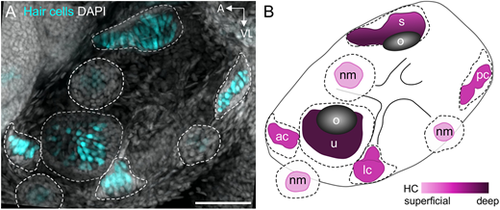
Inner ear organs of the larval zebrafish. (A) Maximum intensity projection image of Tg(myo6b:GFP) 5 dpf larval zebrafish ear. GFP-labeled hair cells are shown in cyan and DAPI-labeled nuclei are shown in gray. Dotted outlines delineate neuromast and inner ear organ boundaries. Scale bar: 50 µm. (B) Diagram of a 5 dpf larval zebrafish ear. Color gradient indicates depth of organs, where lighter colors indicate more superficial structures and darker colors indicate deeper structures. Dotted outlines delineate neuromast and inner ear organ boundaries, while color-filled areas indicate location of hair cells. ac, anterior crista; lc, lateral crista; nm, neuromast; o, otolith; pc, posterior crista; s, saccule; u, utricle. |
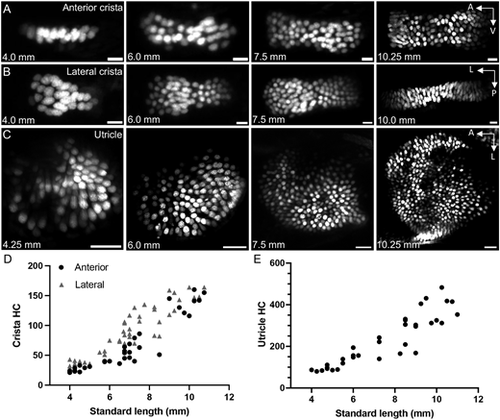
Addition of hair cells during larval zebrafish growth. (A) Maximum intensity projections of Tg(myo6b:NLS-Eos) anterior crista hair cells at standard lengths 4.0 mm, 6.0 mm, 7.5 mm and 10.25 mm. Scale bars: 10 μm. (B) Maximum intensity projections of lateral crista hair cells at standard lengths 4.0 mm, 6.0 mm, 7.5 mm and 10.0 mm. Scale bars: 10 μm. (C) Maximum intensity projections of utricle hair cells at standard lengths 4.25 mm, 6.0 mm, 7.5 mm and 10.25 mm. Scale bars: 20 μm. (D) Quantification of hair cell number in the anterior and lateral cristae across the larval stage of development. Anterior crista data points are represented by black circles (n=35), whereas the lateral crista results are represented by gray triangles (n=47). Each data point represents one ear from one fish. (E) Quantification of utricle hair cell number across the larval stage (n=34). |
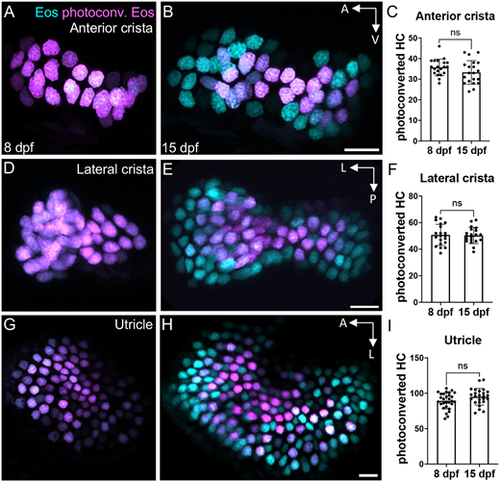
Little hair cell turnover occurs in the larval zebrafish ear. (A,B) Representative maximum intensity projection images of Tg(myo6b:NLS-Eos) anterior cristae (A) immediately post-photoconversion at 8 days post-fertilization (dpf) or (B) 1 week post-photoconversion at 15 dpf. Hair cells that were photoconverted retained photoconverted (magenta) Eos signal, while new hair cells have unconverted (cyan) Eos only. (C) Quantification of anterior crista photoconverted hair cells at 8 and 15 dpf (n=20 at 8 dpf, 20 at 15 dpf). (D-I) Analogous results for the lateral crista (n=20, 20) (D-F) and for the utricle (n=29, 25) (G-I). Unpaired t-tests indicate no significant difference between the number of photoconverted hair cells at these two timepoints (anterior crista P=0.125, lateral crista P=0.859, utricle P=0.071). Scale bars: 10 µm. Data are mean±s.d. |
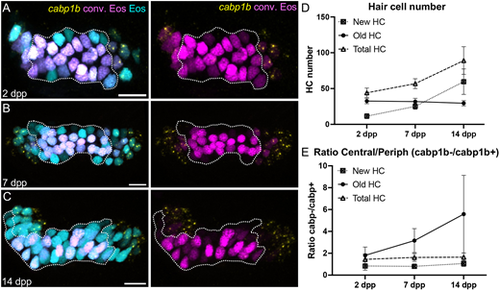
Identification of inner ear hair cell subtypes during larval growth. (A-C) Maximum intensity projection images of HCR-FISH probing for cabp1b expression in Tg(myo6b:NLS-Eos) anterior cristae at (A) 2 days post-photoconversion (dpp) (10 dpf, n=14); (B) 7 days dpp (15 dpf, n=12); and (C) 14 dpp (22 dpf, n=8). Old hair cells retain photoconverted (magenta) Eos signal while new hair cells have unconverted (cyan) Eos only. Peripheral-type hair cells are labeled by the cabp1b HCR probe (yellow). Dotted outline delineates the central cabp1b− region of the sensory patch. Scale bars: 10 µm. (D) Increase in hair cell numbers over the course of the experiment. (E) Ratio of central (cabp1−) to peripheral (cabp1b+) hair cells over time. The increased ratio for old cells suggests phenotypic conversion from peripheral to central hair cell type over time. Data are mean±s.d. |
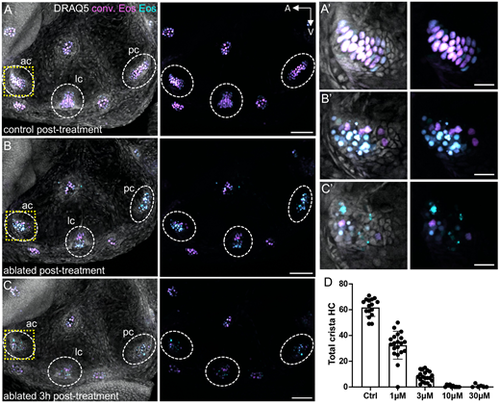
Trpv1-capsaicin hair cell ablation. (A) Maximum intensity projection of a photoconverted 8 dpf Tg(myo6b:NLS-Eos) larval inner ear immediately after 1 h of treatment with 10 μM capsaicin. (B,C) Maximum intensity projection of a sibling Tg(myo6b:NLS-Eos);Tg(myo6b:TrpV1-mClover) inner ear immediately after 1 h of capsaicin treatment (B) or 3 h after capsaicin wash out (C). Images show photoconverted (magenta) and unconverted (cyan) Eos signal with and without DRAQ5-labeled nuclei. Dashed oval regions indicate anterior, lateral and posterior cristae. The areas outlined by a dashed yellow line indicate the magnified anterior cristae regions shown in A′-C′. (D) Dose-response curve for hair cells at 5 dpf after 1 h of treatment with capsaicin at different concentrations. Control treatment represents DMSO alone. Each data point represents the number of hair cells in combined anterior, lateral and posterior crista of one fish ear (n=6-20). Data are mean±s.d. Scale bars: 50 µm (A-C); 10 µm (A′-C′). |
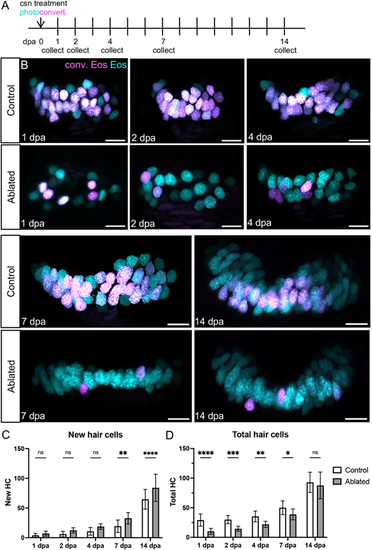
Anterior crista hair cells regenerate during the 2 weeks that follow ablation. (A) Tg(myo6b:NLS-Eos) sibling larvae with or without Tg(myo6b:TrpV1-mClover) were photoconverted and treated with capsaicin to ablate hair cells at 8 dpf. Larvae were collected at five timepoints over the following 2 weeks: 1 (n=22 control, 25 ablated), 2 (n=13, 20), 4 (n=19, 18), 7 (n=16, 13) or 14 (n=18, 15) days-post ablation. (B) Representative maximum intensity projections of anterior crista in control and ablated fish at five timepoints after treatment. Nuclei of cells that survived capsaicin treatment contain photoconverted Eos (magenta). Hair cells newly added after capsaicin treatment have nuclei with only unconverted Eos (cyan). Scale bars: 10 µm. (C) Quantification of new (cyan only) hair cells in ablated and control anterior crista. Two-way ANOVA variation across condition, P<0.0001; Šídák's multiple comparisons post-hoc test for 7 dpa, **adjusted P-value=0.0021, and for 14 dpa, ****adjusted P-value<0.0001. (D) Quantification of total hair cells in ablated and control anterior crista. Two-way ANOVA variation across condition, ****P<0.0001; Šídák's multiple comparisons post-hoc test for 1 dpa, ****adjusted P-value<0.0001, for 2 dpa, ***adjusted P-value=0.0006, for 4 dpa, **adjusted P-value=0.0015, and for 7 dpa *adjusted P-value=0.0342. Data are mean±s.d. |
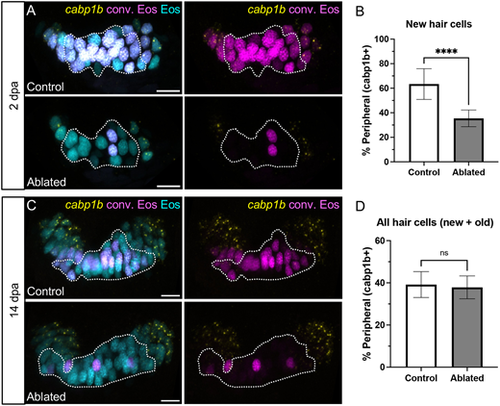
Hair cell central-peripheral patterning is restored after ablation. (A) Representative maximum intensity projections of anterior crista in control and ablated fish at 2 dpa with cabp1b HCR-FISH. Photoconverted Eos (magenta) and cabp1b (yellow) channels are shown with and without unconverted Eos (cyan). Dotted outline delineates the central cabp1b− region of the sensory patch. (B) Quantification of cabp1b+ new hair cells, shown as a percentage of all new (cyan only) hair cells in control (n=18) and ablated (n=16) anterior cristae. Unpaired t-test, ****P<0.0001. (C,D) Analogous data to A,B for crista at 14 dpa (n=18 control, 15 ablated). Unpaired t-test, P=0.5226. Scale bars: 10 µm. Data are mean±s.d. |
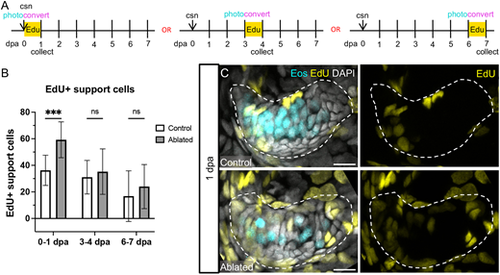
Support cells proliferate in response to hair cell ablation. (A) Larvae were incubated in EdU for 24 h immediately after hair cell ablation, at 3 dpa or at 6 dpa, and were collected at the end of the 24 h incubation. Photoconversion was performed before administration of EdU. (B) Quantification of EdU-labeled support cells in the combined anterior and lateral cristae in control and ablated fish incubated in EdU at 0-1 dpa (n=13 control, 14 ablated), 3-4 dpa (n=19, 12) or 6-7 dpa (n=9, 7). Two-way ANOVA is significant across condition (P=0.0021). Šídák's multiple comparisons post-hoc test at 0-1 dpa, ***adjusted P-value=0.0004. Data are mean±s.d. (C) Representative maximum intensity projections of anterior crista in control and ablated fish incubated with EdU at 0-1 dpa with Eos-labeled hair cells in cyan and EdU-labeled nuclei in yellow. Scale bars: 10 µm. |
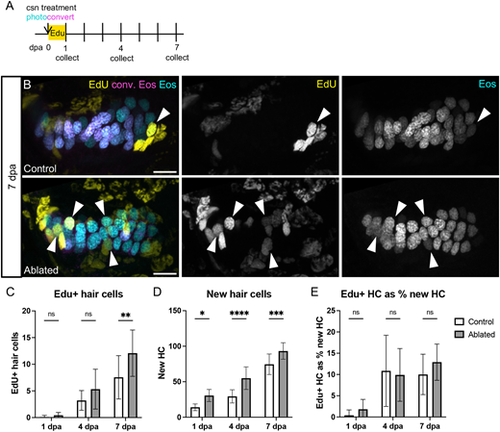
EdU-labeling of hair cells over the week after ablation. (A) Larvae were incubated in EdU for 24 h after photoconversion and hair cell ablation, and were collected either at the end of the incubation (1 dpa; n=10 control, 7 ablated) or at 4 (n=14, 8) or 7 (n=9, 13) dpa. (B) Representative maximum intensity projections of anterior crista in control and ablated fish at 7 dpa. White arrowheads indicate examples of hair cells added since ablation with EdU signal (yellow) and only unconverted Eos (cyan, no magenta). Scale bars: 10 µm. (C) Quantification of EdU+ hair cells in the combined anterior and lateral cristae at each timepoint in control and ablated fish. Two-way ANOVA is significant across conditions, P=0.0050; Šídák's multiple comparisons post-hoc test 7 dpa, **adjusted P-value=0.0034. (D) Quantification of new (cyan only) hair cells at each timepoint in control and ablated fish. Two-way ANOVA is significant across conditions, P<0.0001; Šídák's multiple comparisons post-hoc test at 1 dpa, *adjusted P-value=0.0123, at 4 dpa, ****adjusted P-value<0.0001, and at 7 dpa, ***adjusted P-value=0.0010. (E) EdU+ hair cells as a percentage of new hair cells. Two-way ANOVA with Šídák's multiple comparisons post-hoc test is not significant across conditions at any timepoint. Data are mean±s.d. |