
|
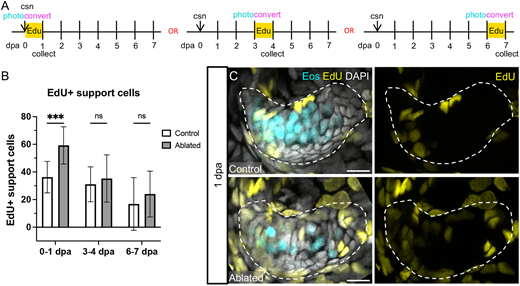
Fig. 8 Support cells proliferate in response to hair cell ablation. (A) Larvae were incubated in EdU for 24 h immediately after hair cell ablation, at 3 dpa or at 6 dpa, and were collected at the end of the 24 h incubation. Photoconversion was performed before administration of EdU. (B) Quantification of EdU-labeled support cells in the combined anterior and lateral cristae in control and ablated fish incubated in EdU at 0-1 dpa (n=13 control, 14 ablated), 3-4 dpa (n=19, 12) or 6-7 dpa (n=9, 7). Two-way ANOVA is significant across condition (P=0.0021). Šídák's multiple comparisons post-hoc test at 0-1 dpa, ***adjusted P-value=0.0004. Data are mean±s.d. (C) Representative maximum intensity projections of anterior crista in control and ablated fish incubated with EdU at 0-1 dpa with Eos-labeled hair cells in cyan and EdU-labeled nuclei in yellow. Scale bars: 10 µm.