
|
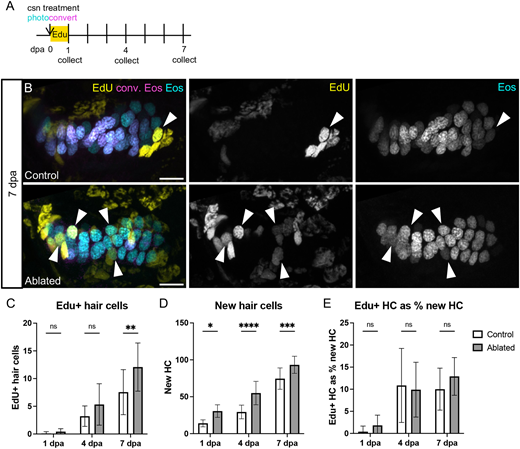
Fig. 9 EdU-labeling of hair cells over the week after ablation. (A) Larvae were incubated in EdU for 24 h after photoconversion and hair cell ablation, and were collected either at the end of the incubation (1 dpa; n=10 control, 7 ablated) or at 4 (n=14, 8) or 7 (n=9, 13) dpa. (B) Representative maximum intensity projections of anterior crista in control and ablated fish at 7 dpa. White arrowheads indicate examples of hair cells added since ablation with EdU signal (yellow) and only unconverted Eos (cyan, no magenta). Scale bars: 10 µm. (C) Quantification of EdU+ hair cells in the combined anterior and lateral cristae at each timepoint in control and ablated fish. Two-way ANOVA is significant across conditions, P=0.0050; Šídák's multiple comparisons post-hoc test 7 dpa, **adjusted P-value=0.0034. (D) Quantification of new (cyan only) hair cells at each timepoint in control and ablated fish. Two-way ANOVA is significant across conditions, P<0.0001; Šídák's multiple comparisons post-hoc test at 1 dpa, *adjusted P-value=0.0123, at 4 dpa, ****adjusted P-value<0.0001, and at 7 dpa, ***adjusted P-value=0.0010. (E) EdU+ hair cells as a percentage of new hair cells. Two-way ANOVA with Šídák's multiple comparisons post-hoc test is not significant across conditions at any timepoint. Data are mean±s.d.