
|
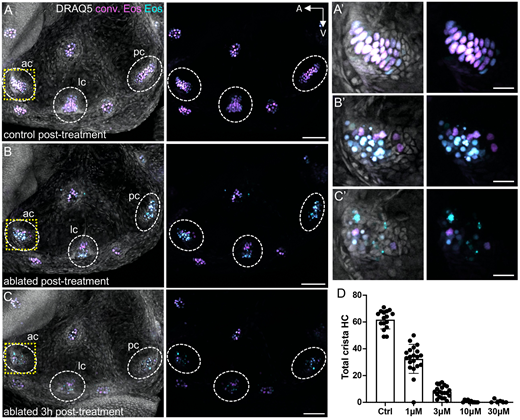
Fig. 5 Trpv1-capsaicin hair cell ablation. (A) Maximum intensity projection of a photoconverted 8 dpf Tg(myo6b:NLS-Eos) larval inner ear immediately after 1 h of treatment with 10 μM capsaicin. (B,C) Maximum intensity projection of a sibling Tg(myo6b:NLS-Eos);Tg(myo6b:TrpV1-mClover) inner ear immediately after 1 h of capsaicin treatment (B) or 3 h after capsaicin wash out (C). Images show photoconverted (magenta) and unconverted (cyan) Eos signal with and without DRAQ5-labeled nuclei. Dashed oval regions indicate anterior, lateral and posterior cristae. The areas outlined by a dashed yellow line indicate the magnified anterior cristae regions shown in A′-C′. (D) Dose-response curve for hair cells at 5 dpf after 1 h of treatment with capsaicin at different concentrations. Control treatment represents DMSO alone. Each data point represents the number of hair cells in combined anterior, lateral and posterior crista of one fish ear (n=6-20). Data are mean±s.d. Scale bars: 50 µm (A-C); 10 µm (A′-C′).