
|
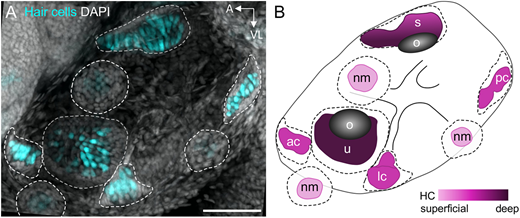
Fig. 1 Inner ear organs of the larval zebrafish. (A) Maximum intensity projection image of Tg(myo6b:GFP) 5 dpf larval zebrafish ear. GFP-labeled hair cells are shown in cyan and DAPI-labeled nuclei are shown in gray. Dotted outlines delineate neuromast and inner ear organ boundaries. Scale bar: 50 µm. (B) Diagram of a 5 dpf larval zebrafish ear. Color gradient indicates depth of organs, where lighter colors indicate more superficial structures and darker colors indicate deeper structures. Dotted outlines delineate neuromast and inner ear organ boundaries, while color-filled areas indicate location of hair cells. ac, anterior crista; lc, lateral crista; nm, neuromast; o, otolith; pc, posterior crista; s, saccule; u, utricle.