
|
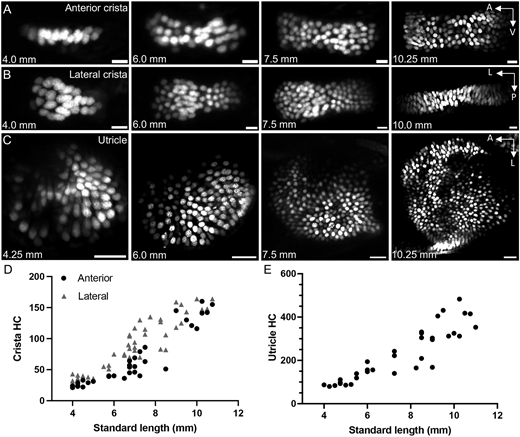
Fig. 2 Addition of hair cells during larval zebrafish growth. (A) Maximum intensity projections of Tg(myo6b:NLS-Eos) anterior crista hair cells at standard lengths 4.0 mm, 6.0 mm, 7.5 mm and 10.25 mm. Scale bars: 10 μm. (B) Maximum intensity projections of lateral crista hair cells at standard lengths 4.0 mm, 6.0 mm, 7.5 mm and 10.0 mm. Scale bars: 10 μm. (C) Maximum intensity projections of utricle hair cells at standard lengths 4.25 mm, 6.0 mm, 7.5 mm and 10.25 mm. Scale bars: 20 μm. (D) Quantification of hair cell number in the anterior and lateral cristae across the larval stage of development. Anterior crista data points are represented by black circles (n=35), whereas the lateral crista results are represented by gray triangles (n=47). Each data point represents one ear from one fish. (E) Quantification of utricle hair cell number across the larval stage (n=34).