
- Title
-
A UTP3-dependent nucleolar translocation pathway facilitates pre-rRNA 5'ETS processing
- Authors
- Bao, J., Su, B., Chen, Z., Sun, Z., Peng, J., Zhao, S.
- Source
- Full text @ Nucleic Acids Res.
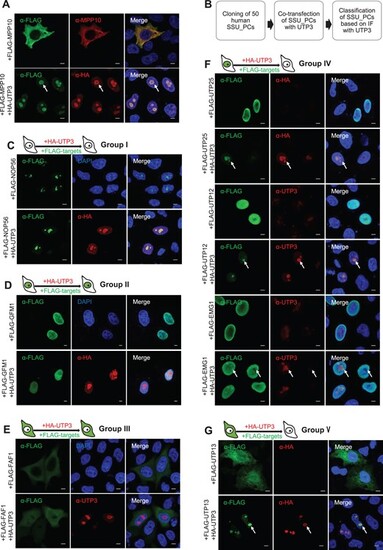
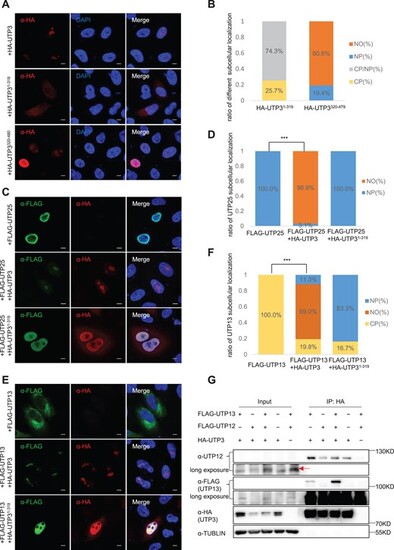
Nucleolar localization of human MPP10, UTP25/DEF, UTP13/TBL3, UTP12/WDR3 or EMG1 is UTP3/SAS10-dependent. (A) Nucleolar localization of human MPP10 is UTP3-dependent. HeLa cells were transfected with FLAG-tagged MPP10 plasmid alone or together with HA-tagged UTP3 plasmid for 48 h and were then subjected to immunofluorescence staining (IF) using the FLAG, MPP10 or HA antibodies as indicated. Scale bar, 5 μm. (B) Outline of the flowchart of the screening for SSU processome components (SSU_PCs) whose nucleolar localization is UTP3-dependent. (C–G) Showing the IF images of NOP56 representing the group I proteins (C), GFM1 representing the group II proteins (D), FAF1 representing the group III proteins (E), UTP25, UTP12 and EMG1 (group VI) (F), and UTP13 (group V) (G) expressed alone or together with UTP3 in HeLa cells 48 h post-transfection. IF was performed using FLAG, HA or UTP3 antibodies as indicated. DAPI (blue), staining the nuclei. |
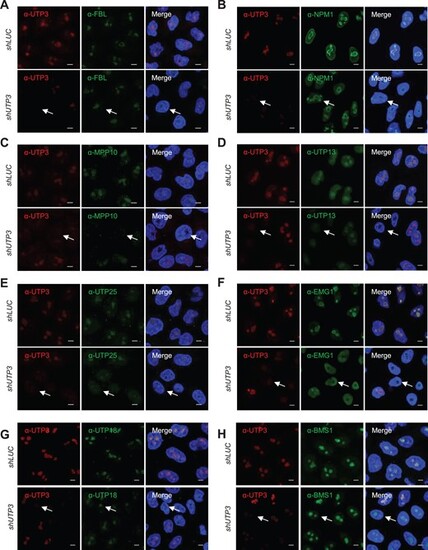
Nucleolar localization of the endogenous MPP10, UTP13, UTP25 and EMG1 is UTP3-dependent. (A–H) Representative images showing the effect of knockdown of the endogenous UTP3 on nucleolar localization of FBL (A), NPM1 (B), MPP10 (C), UTP13 (D), UTP25 (E), EMG1 (F), UTP18 (G) and BMS1 (H) in HeLa cells. The endogenous UTP3 protein was knocked down using the DOX-inducible UTP3-specific shRNA (shUTP3). The LUC shRNA (shLUC) was used as a negative control. Immunofluorescence staining using antibodies against FBL, NPM1, UTP3, MPP10, UTP13, UTP25 and EMG1 were performed 96 h after DOX treatment. Nuclei (blue) were stained with DAPI. Scale bar, 5μm. Arrow in each panel indicates a representative UTP3-knockdown cell. |
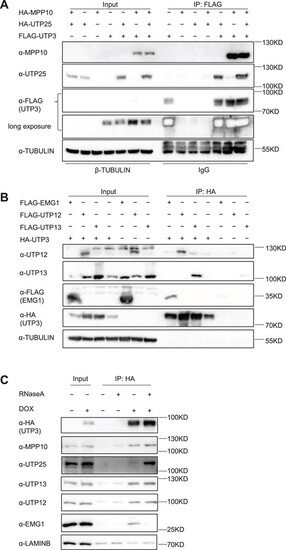
UTP3 complexes with MPP10, UTP25, UTP12, UTP13 and EMG1. (A and B) Western blot showing the Co-IP product pulled down using a FLAG antibody (FLAG fused to UTP3) (A) or an HA antibody (HA fused to UTP3) (B). In (A), MPP10 and UTP25 were fused with an HA tag, and in (B), UTP12, UTP13 and EMG1 were fused with a FLAG tag. TUBULIN was used as loading control. (C) Western blot showing the effect of RNase treatment on the interaction between UTP3 and the endogenous MPP10, UTP25, UTP12, UTP13 or EMG1. Total proteins were extracted from the DOX-inducible HA-UTP3 overexpression cells. UTP3 was detected using an HA antibody, the endogenous MPP10, UTP25, UTP12, UTP13 and EMG1 were detected using their corresponding specific antibodies. Considering the weak non-specific binding of MPP10, UTP12 and UTP13 by the beads, non-specific beads-bound LAMINB in IP products was used as a loading control. |
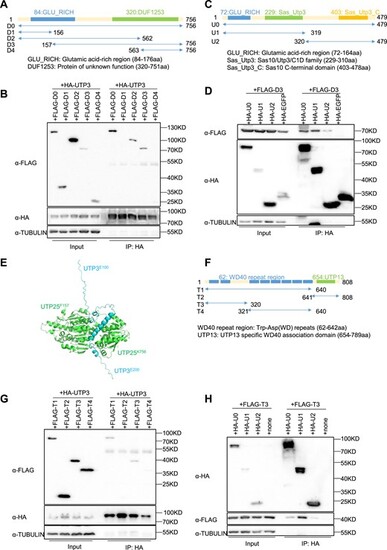
The N-terminus of UTP3 is required to complex with both UTP25 and UTP13. (A) Diagram showing the different UTP25 derivatives (D0 to D4) generated by N- or C-terminal truncation. (B) Western blot of the Co-IP products pulled down using the HA antibody (HA was tagged to UTP3) for analyzing the interaction of the full length UTP3 with different UTP25 derivatives as indicated. UTP25 derivatives were detected using a FLAG antibody. TUBULIN was used as a loading control for the input. (C) Diagram showing the different UTP3 derivatives (U0 to U2) generated by N- or C-terminal truncation. (D) Western blot of the Co-IP products pulled down using the HA antibody (HA was tagged to the UTP3 and its derivatives) for analyzing the interaction of D3 (a UTP25 derivative) with different UTP3 derivatives as indicated. TUBULIN was used as a loading control for the input. Note, the membrane after blotting with the HA antibody was re-used for blotting of TUBULIN, which explains the bands observed on the right side of the Co-IP product because the striping was not complete. (E) Predicted structure of the complex formed by D3 (green, UTP25F157-K756) and UTPE100-E200 (cyan) by the AlphaFold-Multimer tool. The N- and C-termini of D3 and UTPE100-E200 were indicated. (F) Diagram showing the different UTP13 derivatives (T1 to T4) generated by N- or C-terminal truncation. (G and H) Western blot of the Co-IP products pulled down using the HA antibody (HA was tagged to UTP3 and its derivatives) for identifying the interacting domain in UTP13 (G) and UTP3 (H) for their interaction as indicated. UTP13 derivatives were detected using a FLAG antibody. TUBULIN was used as a loading control for the input. Note, the membrane after blotting with the FLAG antibody was re-used for blotting of TUBULIN, which explains the bands observed on the right side of the Co-IP product because the striping was not complete. |
UTP3 nucleolar localization domain is indispensable for translocating UTP25 and UTP13 to the nucleolus. (A and B) Immunostaining of UTP3 derivative U0, U1 and U2 in HeLa cells 48 h after transfecting with corresponding plasmids (A). U0 and U2, but not U1, were able to enter the nucleolus (A). The ratio of the cells exhibiting the defined subcellular localization was shown in (B). (C–F) Co-immunostaining of U0 or U1 with UTP25 (C) or UTP13 (E) in HeLa cells 48 h after transfecting with corresponding plasmids as indicated. The ratios of the cells exhibiting the defined subcellular localization for UTP25 (D) or UTP13 (F) were provided. In (B), (D) and (F), CP, cytoplasm; NP, nucleoplasm; NO, nucleolus. (G) Western blot analysis of the Co-IP product pulled down using the HA antibody for analyzing the interaction between UTP3 and UTP13 in the absence or presence of UTP12. UTP3 was detected by the HA antibody, UTP13 by the FLAG antibody and UTP12 by the UTP12 antibody, respectively. |
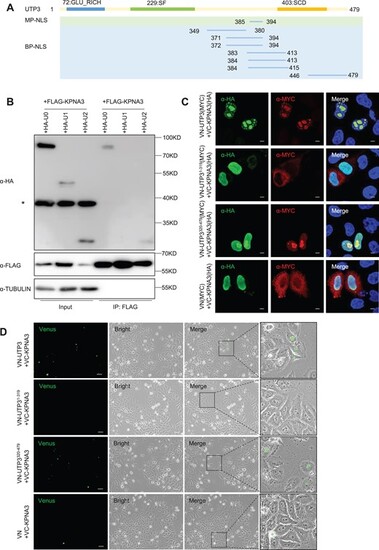
The C-terminus of UTP3 interacts with KPNA3. (A) Diagram showing predicted Nuclear Localization Sequences (NLSs), determined via the NLS Mapper tool, with a set cut-off score of 5. MP-NLS, predicted monopartite NLS; BP-NLS, predicted bipartite NLS. (B) Western blot of the Co-IP products pulled down using the FLAG antibody (FLAG was tagged to the KPNA3) for analyzing the interaction of KPNA3 with different UTP3 derivatives as indicated. TUBULIN was used as a loading control for the input. Star denotes unspecific bands. (C) Immunostaining of bimolecular fluorescence complementation experiment. Co-immunostaining of KPNA3 with UTP3, UTP3 derivatives or vector in HeLa cells 48 h after transfecting with corresponding plasmids. KPNA3 were detected using an HA antibody, UTP3 derivatives or vector were detected using a MYC antibody. Scale bar, 5 μm. (D) Live cell images of the bimolecular fluorescence complementation system were captured 48 h post-transfection. The plasmids used were indicated in the figure panels. The magnification view of black box is shown on the right. Scale bar, 50 μm. |
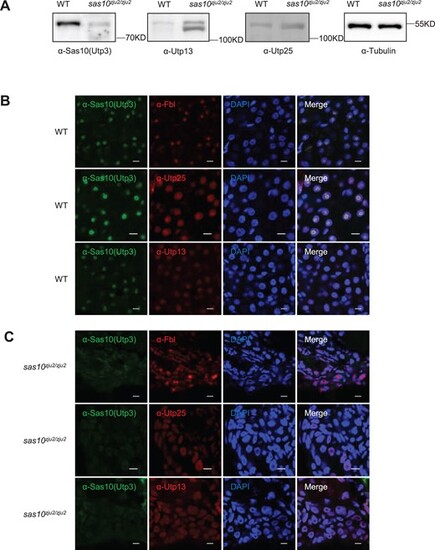
The ferry function of UTP3 is conserved in zebrafish. (A) Western blot analysis of Utp3, Utp25 and Utp13 in WT and sas10zju2/zju2. (B and C) Representative images showing the co-immunostaining of Utp3 (green) with Fbl, Utp25 or Utp13 (red) in the embryonic liver of WT (B) and sas10zju2/zju2 (C) at 5dpf. DAPI, staining the nuclei. Scale bar, 5μm. |
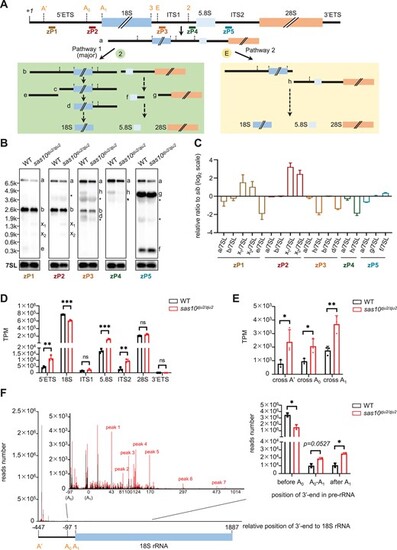
Loss-of-function of utp3 causes an accumulation of aberrant products containing 5′ETS. (A) Diagram showing the zebrafish rDNA genomic structure and positions of the five probes (zP1 to zP5) for Northern blot. (B) Comparison of the processed rRNA species in WT and sas10zju2/zju2 by Northern blot using two 5′ETS (zP1, and zP2) probes, two ITS1 (zP3 and zP4) probes and one ITS2 (zP5) probe. The intermediate products of pre-rRNA processing in zebrafish were highlighted according to (A). WT, wild type; x1, aberrant band 1, x2, aberrant band 2. Stars denote unspecific bands, with the larger one representing 28S and the smaller one representing 18S, caused by the oversensitivity of biotin probes. (C) Ratio analysis of multiple precursors (RAMP) derived from three independent Northern blot experiments. Different colors of bars represent analyses derived from distinct probes as indicated. (D) Graph showing the statistical analysis of the TPM-based sequence reads derived from the total RNA-seq data for 5′ETS, 18S, ITS1, 5.8S, ITS2, 28S and 3′ETS in WT and sas10zju2/zju2. (E) Statistical analysis of reads encompassing A′, A0, and A1 cleavage sites in WT and sas10zju2/zju2. (F) 3′RACE analysis to determine the enrichment of 3′-end reads along the pre-rRNA in WT and sas10zju2/zju2. Left panel: comparison of the 3′-end reads along the A′ (−447nt) to 18S rRNA (1887nt) region between WT (black peak line) and sas10zju2/zju2 (red peak line). The region after A0 (including the A0 to A1 and the 18S rRNA regions) was magnified to facilitate the visualization and comparison of the distribution of 3′-end reads in WT and sas10zju2/zju2. The 3′RACE_Fw_zf_5′ETS primer was used in 3′RACE to generate the library for sequencing. Right panel: statistical analysis of the distribution of 3′-end reads encompassed in the regions of before A0 site, between A0 and A1, and after A1 in the WT and sas10zju2/zju2. |
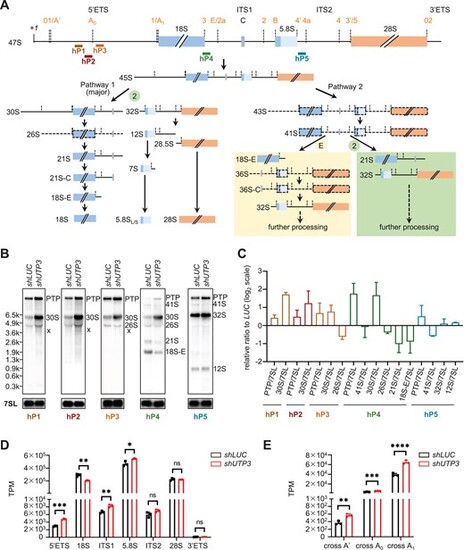
Depletion of human UTP3 mainly impairs the 5′ETS processing at the A0-site. (A) Diagram showing the human rDNA genomic structure and positions of the five probes (hP1 to hP5) for Northern blot. Short-lived precursors are represented with dotted lines. (B) Comparison of the processed rRNA species in shLUC and shUTP3 cells by Northern blot using three 5′ETS (hP1, hP2, hP3) probes, one ITS1 (hP4) probe and one ITS2 (hP5) probe. The intermediate products of pre-rRNA processing in cells were highlighted according to (A). PTP: primary transcript plus, co-migrating 47S and 45S pre-rRNAs; x: aberrant band. (C) Ratio analysis of multiple precursors (RAMP) derived from three independent Northern blot experiments. Different colors of bars represent analyses derived from distinct probes as indicated. (D) Graph showing the statistical analysis of the TPM-based sequence reads derived from the total RNA-seq data for 5′ETS, 18S, ITS1, 5.8S, ITS2, 28S and 3′ETS in shLUC and shUTP3 cells. (E) Statistical analysis of reads encompassing A′, A0 and A1 cleavage sites in shLUC and shUTP3 cells. |
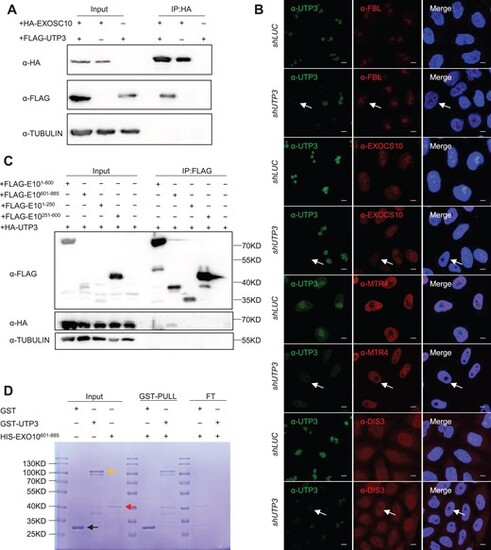
UTP3 directly interacts with and mediates the nucleolar localization of EXOSC10. (A) Western blot showing the Co-IP product pulled down using an HA antibody (HA fused to EXOSC10). TUBULIN was used as the loading control. (B) Representative images showing the effect of knockdown of the endogenous UTP3 on nucleolar localization of FBL, EXOSC10, MTR4 and DIS3 in HeLa cells. The shLUC was used as a negative control. Scale bar, 5μm. Arrow in each panel indicates a representative UTP3 knockdown cell. (C) Western blot of the Co-IP products pulled down using the FLAG antibody (FLAG was tagged to derivatives of EXOSC10) for identifying the interaction domain between EXOSC10 and UTP3. Co-IP result showed that UTP3 interacted with the C-terminal region of EXOSC10 (E10601-885), as indicated. (D) GST-pull down experiment showing the direct interaction between UTP3 and EXOSC10. Recombinant GST (black arrow), GST-UTP3 (yellow arrow) and HIS-EXOSC10601-885 (red arrow) were expressed and purified. Since GST-UTP3 lane displayed a non-specific band of similar size to HIS-EXOSC10601-885, the flowthrough (FT) fraction after GST resin incubation was run in parallel to show that the EXOSC10601-885 was retained by the beads when being co-incubated with GST-UTP3 but not with GST. |