
Fig. 8
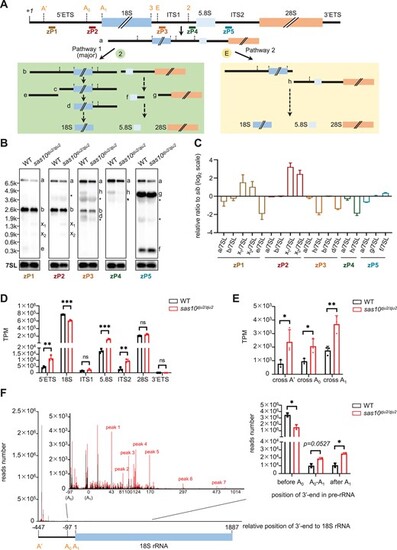
Loss-of-function of utp3 causes an accumulation of aberrant products containing 5′ETS. (A) Diagram showing the zebrafish rDNA genomic structure and positions of the five probes (zP1 to zP5) for Northern blot. (B) Comparison of the processed rRNA species in WT and sas10zju2/zju2 by Northern blot using two 5′ETS (zP1, and zP2) probes, two ITS1 (zP3 and zP4) probes and one ITS2 (zP5) probe. The intermediate products of pre-rRNA processing in zebrafish were highlighted according to (A). WT, wild type; x1, aberrant band 1, x2, aberrant band 2. Stars denote unspecific bands, with the larger one representing 28S and the smaller one representing 18S, caused by the oversensitivity of biotin probes. (C) Ratio analysis of multiple precursors (RAMP) derived from three independent Northern blot experiments. Different colors of bars represent analyses derived from distinct probes as indicated. (D) Graph showing the statistical analysis of the TPM-based sequence reads derived from the total RNA-seq data for 5′ETS, 18S, ITS1, 5.8S, ITS2, 28S and 3′ETS in WT and sas10zju2/zju2. (E) Statistical analysis of reads encompassing A′, A0, and A1 cleavage sites in WT and sas10zju2/zju2. (F) 3′RACE analysis to determine the enrichment of 3′-end reads along the pre-rRNA in WT and sas10zju2/zju2. Left panel: comparison of the 3′-end reads along the A′ (−447nt) to 18S rRNA (1887nt) region between WT (black peak line) and sas10zju2/zju2 (red peak line). The region after A0 (including the A0 to A1 and the 18S rRNA regions) was magnified to facilitate the visualization and comparison of the distribution of 3′-end reads in WT and sas10zju2/zju2. The 3′RACE_Fw_zf_5′ETS primer was used in 3′RACE to generate the library for sequencing. Right panel: statistical analysis of the distribution of 3′-end reads encompassed in the regions of before A0 site, between A0 and A1, and after A1 in the WT and sas10zju2/zju2. |