
Fig. 4
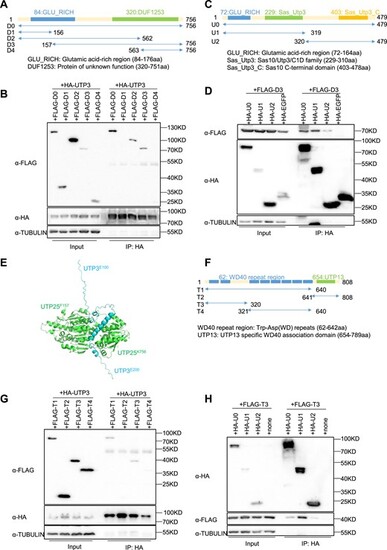
The N-terminus of UTP3 is required to complex with both UTP25 and UTP13. (A) Diagram showing the different UTP25 derivatives (D0 to D4) generated by N- or C-terminal truncation. (B) Western blot of the Co-IP products pulled down using the HA antibody (HA was tagged to UTP3) for analyzing the interaction of the full length UTP3 with different UTP25 derivatives as indicated. UTP25 derivatives were detected using a FLAG antibody. TUBULIN was used as a loading control for the input. (C) Diagram showing the different UTP3 derivatives (U0 to U2) generated by N- or C-terminal truncation. (D) Western blot of the Co-IP products pulled down using the HA antibody (HA was tagged to the UTP3 and its derivatives) for analyzing the interaction of D3 (a UTP25 derivative) with different UTP3 derivatives as indicated. TUBULIN was used as a loading control for the input. Note, the membrane after blotting with the HA antibody was re-used for blotting of TUBULIN, which explains the bands observed on the right side of the Co-IP product because the striping was not complete. (E) Predicted structure of the complex formed by D3 (green, UTP25F157-K756) and UTPE100-E200 (cyan) by the AlphaFold-Multimer tool. The N- and C-termini of D3 and UTPE100-E200 were indicated. (F) Diagram showing the different UTP13 derivatives (T1 to T4) generated by N- or C-terminal truncation. (G and H) Western blot of the Co-IP products pulled down using the HA antibody (HA was tagged to UTP3 and its derivatives) for identifying the interacting domain in UTP13 (G) and UTP3 (H) for their interaction as indicated. UTP13 derivatives were detected using a FLAG antibody. TUBULIN was used as a loading control for the input. Note, the membrane after blotting with the FLAG antibody was re-used for blotting of TUBULIN, which explains the bands observed on the right side of the Co-IP product because the striping was not complete. |