
|
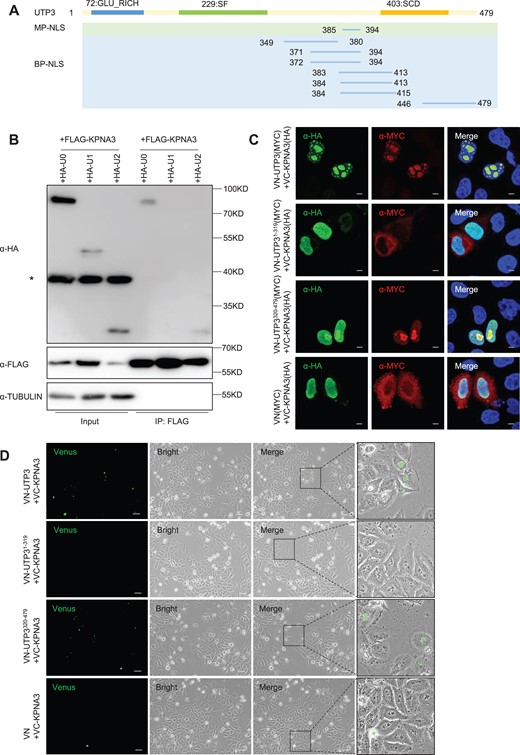
Fig. 6 The C-terminus of UTP3 interacts with KPNA3. (A) Diagram showing predicted Nuclear Localization Sequences (NLSs), determined via the NLS Mapper tool, with a set cut-off score of 5. MP-NLS, predicted monopartite NLS; BP-NLS, predicted bipartite NLS. (B) Western blot of the Co-IP products pulled down using the FLAG antibody (FLAG was tagged to the KPNA3) for analyzing the interaction of KPNA3 with different UTP3 derivatives as indicated. TUBULIN was used as a loading control for the input. Star denotes unspecific bands. (C) Immunostaining of bimolecular fluorescence complementation experiment. Co-immunostaining of KPNA3 with UTP3, UTP3 derivatives or vector in HeLa cells 48 h after transfecting with corresponding plasmids. KPNA3 were detected using an HA antibody, UTP3 derivatives or vector were detected using a MYC antibody. Scale bar, 5 μm. (D) Live cell images of the bimolecular fluorescence complementation system were captured 48 h post-transfection. The plasmids used were indicated in the figure panels. The magnification view of black box is shown on the right. Scale bar, 50 μm.