
- Title
-
Characterization of ClC-1 chloride channels in zebrafish: a new model to study myotonia
- Authors
- Gaitán-Peñas, H., Pérez-Rius, C., Muhaisen, A., Castellanos, A., Errasti-Murugarren, E., Barrallo-Gimeno, A., Alcaraz-Pérez, F., Estévez, R.
- Source
- Full text @ J. Physiol.
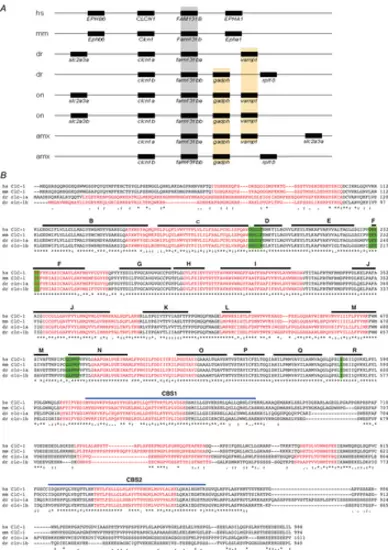
GENOMIC ANALYSIS OF THE CLCN1 GENES A, genomic organization of the CLCN1 locus in humans (Hs), mice (Mm), zebrafish (Dr), nile tilapia (On) and mexican tetra (Amx). Several genes around the CLCN1 locus are conserved. B, alignment of the predicted protein sequences of human, mouse, and zebrafish ClC-1 channels performed with CLUSTALW. α-helices are labelled with a black line. The CBS (cystathionine β-synthase) intracellular domains are marked with a blue line. Residues involved in chloride selectivity are highlighted with green background. Exons are typed in alternate black and red. Asterisk indicates identical residues among the five proteins, colon indicates conserved residues, and full stop indicates similar residues. |
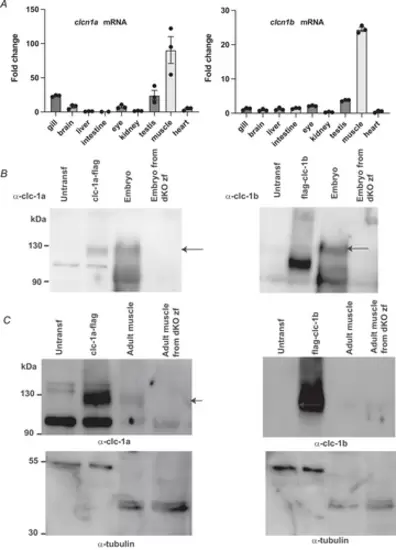
ZEBRAFISH CLCN1 GENE EXPRESSION AND PROTEIN DETECTIONA, relative clcn1 gene expression levels in adult tissues using real-time PCR. Bars indicate means ± SD. Both clcn1 orthologues show a marked preference for skeletal muscle expression. B, western blot detection of clc-1a and clc-1b protein levels in zebrafish embryos and HEK293T cells transfected with flag-tagged versions of both orthologues. Left, anti-flag detection in HEK293T transfected cells lysates. Centre, anti-clc-1a. Right, anti-clc-1b, polyclonal antibody detection in both zebrafish embryo and HEK293T transfected cell lysates. Lysates from dKO embryos were used to control antibody specificity. The specific band is indicated by an arrow. The difference in motility in the case of clc-1b is probably due to the presence of the flag tagged at the N terminus. When the flag tag was at the C-terminus of clc-1b, the protein was very unstable. C, western blot detection of clc-1a and clc-1b protein levels in both zebrafish adult muscle and HEK293T transfected cell lysates with (left) anti-clc-1a and (right) anti-clc-1b, polyclonal antibodies. Lysates from dKO embryos were used to control antibody specificity. The specific band is indicated by an arrow. The detection of tubulin was used as a loading control. Note that tubulin has a different size in HEK transfected cells compared with zebrafish. |
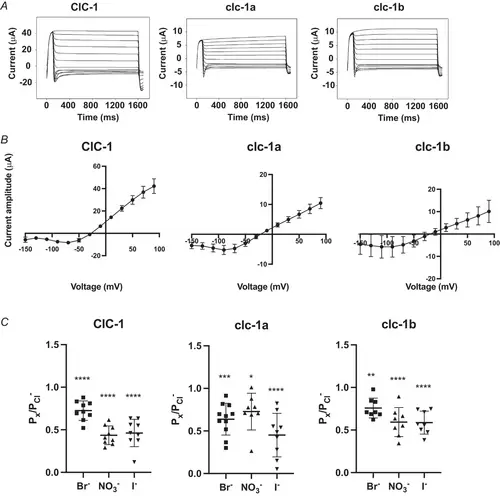
ZEBRAFISH CLC-1-MEDIATED CURRENTS IN XENOPUS OOCYTES A, representative current traces of human ClC-1 and zebrafish orthologues at pH 8.4. The voltage clamp protocol consisted of: 1500 ms voltage steps ranging from +90 mV to −150 mV in −20 mV increments. Each step was preceded by a 100 ms pre-pulse at +90 mV and followed by a 100 ms tail pulse at −90 mV. B, representative steady-state of current amplitude–voltage relationship of human ClC-1 (N = 5), clc-1a (N = 7) and clc-1b (N = 9). C, permeability ratios of Br−, NO3− and I− calculated for each clc-1 variant. Individual data points are depicted and means ± SD are shown. Ordinary one-way ANOVA with Tukey's multiple comparisons test was performed. For human ClC-1 (N = 9), permeability ratios of Br− (P = 0.71E-4), NO3− (P = 0.33E-10) and I− (P = 0.11E-9) were significantly different from Cl−. Similar results were found for clc-1a (N = 11) and clc-1b (N = 8): Br− (P = 0.32E-3 and P = 0.27E-2, respectively), NO3− (P = 0.02 and P = 0.21E-5, respectively) and I− (P = 0.74E-6 and P = 0.16E-5, respectively). Significance is shown as: **** P ≤ 0.0001, *** P ≤ 0.001, ** P ≤ 0.01, * P ≤ 0.05. |

ZEBRAFISH CLC-1 ORTHOLOGUES SHOW DIFFERENT PH DEPENDENCE AND 9-AC INSENSITIVITY A, representative current traces of human ClC-1 and zebrafish orthologues at pH 5.4. B, pH dependence of the apparent open probability (App Po) of human ClC-1 (N = 8), clc-1a (N = 7) and clc-1b (N = 9). Data points indicate means ± SD. Both clc-1 orthologues show marked inversion of their App Po under acidic conditions. C, analysis of 9-AC sensitivity. Bars represent means ± SD of the relative current intensity (normalized to control conditions in the absence of 9AC) measured at +70 mV. Two-tailed unpaired Student's t test statistical analysis was performed comparing control (Ctrl) and 100 µm/1 mm 9-AC groups for each clc-1 variant. 100 µm 9-AC significantly affected human ClC-1 elicited activity (N = 8, P = 0,13E-14), while no significant effect was detected in clc-1a (N = 4, P = 0.13) nor clc-1b (N = 9, P = 0.16). 1 mm 9-AC dramatically altered human ClC-1 activity (N = 4, P = 0.12E-22), also affecting clc-1b (N = 4, P = 4.70E-08). Significance is shown as: **** P ≤ 0.0001, *** P ≤ 0.001. |
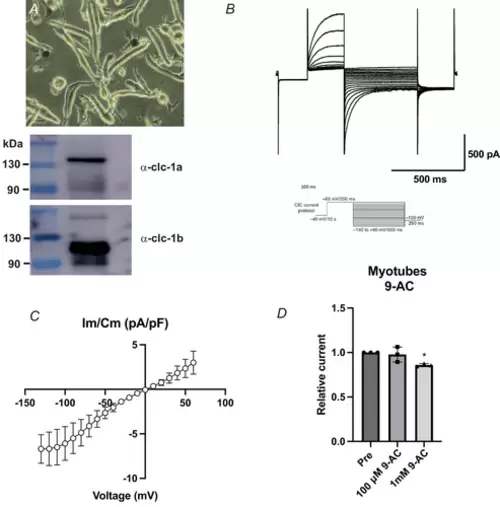
PATCH-CLAMP RECORDINGS OF CLC-1-LIKE CURRENTS IN ZEBRAFISH PRIMARY CULTURES OF MYOTUBES A, close image of a zebrafish primary culture of myotubes. Extracts from myotubes were analysed by western blot using antibodies against clc-1a and clc-1b detecting both proteins in the cultures. B, representative current trace of the elicited activity. Whole-cell currents were elicited by injecting voltage pulses as described in oocytes. C, steady-state I–V relationship of the myotubular clc-1-like current (N = 6). Data points represent means ± SD. D, relative clc-1-like current before (Pre) and after the application of 100 µm and 1 mm 9-AC (N = 3). Ordinary one-way ANOVA with Tukey's multiple comparisons test was performed. While no significant effect was detected after the application of 100 µm 9-AC (P = 0.86), 1 mm 9-AC significantly altered clc-1-like currents (P = 0.03). Both current characteristics and 9-AC reduced sensitivity resemble the clc-1 orthologue current properties previously shown in Xenopus oocyte recordings. |

CLCN1A AND CLCN1B CRISPANTS HAMPER BOTH SPONTANEOUS EXPLORATORY MOVEMENT (SEM) AND MECHANICALLY INDUCED MOVEMENT (MIM), AND BOTH ARE PARTIALLY RECOVERED BY TRANSIENT OVEREXPRESSION OF HCLC-1 A, total distance parameter recorded during the SEM test for both control (black border) and crispant (red border) groups. B, histogram showing the frequency of the distances travelled by each group during the SEM test. C, total distance parameter recorded during the MIM test for both control (black border) and crispant (red border) groups. In A and C, bars represent means ± SD of the total distance, where each dot represents a single larva (A; cr_control, n = 99; cr_clcn1a+b, n = 56; cr_clcn1a+b + hClC-1, n = 22. C; cr_control, n = 33; cr_clcn1a+b, n = 23; cr_clcn1a+b + hClC-1, n = 15). The graphs show the accumulation of 2−3 independent experiments (N = 2-3). Statistical analysis according to ordinary one-way ANOVA followed by uncorrected Fisher's LSD (A) or Kruskal–Wallis followed by uncorrected Dunn's multiple comparisons test (C). Source data are provided in a Source Data file. |
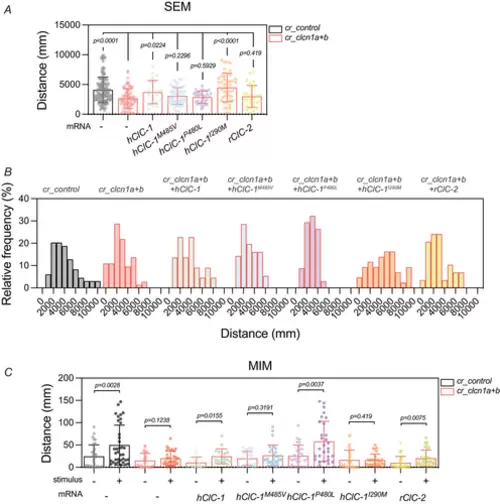
RESCUE OF MOVEMENT DEFECTS BY MYTONIA MUTATIONS AND OTHER CLC CHANNELS A, total distance parameter recorded during the SEM test for each group. B, histogram showing the frequency of the distances travelled by each group during the SEM test. C, total distance parameter recorded during the MIM test for each group. In A and C, bars represent means ± SD of the total distance, where each dot represents a single larva (A; cr_control, n = 133; cr_clcn1a+b, n = 73; cr_clcn1a+b + hClC-1, n = 22; cr_clcn1a+b + hClC-1 M485V, n = 56; cr_clcn1a+b + hClC-1 P480L, n = 34; cr_clcn1a+b + hClC-1 I290M, n = 43; cr_clcn1a+b + rClC-2, n = 29. C; cr_control, n = 36; cr_clcn1a+b, n = 31; cr_clcn1a+b + hClC-1, n = 17; cr_clcn1a+b + hClC-1 M485V, n = 28; cr_clcn1a+b + hClC-1 P480L, n = 29; cr_clcn1a+b + hClC-1 I290M, n = 29; cr_clcn1a+b + rClC-2, n = 31). The graphs show the accumulation of 2−3 independent experiments (N = 2–3). Statistical analysis according to ordinary one-way ANOVA followed by uncorrected Fisher's LSD (A) or Kruskal–Wallis followed by uncorrected Dunn's multiple comparisons test |

MEXILETINE CAN RESCUE THE MIM PHENOTYPE IN THE CRISPANT ZEBRAFISH MYOTONIA MODEL A, total distance parameter recorded during the SEM test for each group. B, histogram showing the frequency of the distances travelled by each group during the SEM test. C, total distance parameter recorded during the MIM test for each group. In A and C, bars represent means ± SD of the total distance, where each dot represents a single larva (A; cr_control, n = 94; cr_control + mexiletine 1µm, n = 60; cr_control + mexiletine 10 um, n = 53; cr_clcn1a+b, n = 43; cr_clcn1a+b + mexiletine 1 µm, n = 24; cr_clcn1a+b + mexiletine 10 µm, n = 22. C; cr_control, n = 33; cr_control + mexiletine 1 µm, n = 38; cr_control + mexiletine 10 µm, n = 43; cr_clcn1a+b, n = 26; cr_clcn1a+b + mexiletine 1 µm, n = 20; cr_clcn1a+b + mexiletine 10 µm, n = 18). The graphs show the accumulation of 2−3 independent experiments (N = 2–3). Statistical analysis according to ordinary Brown-Forsythe ANOVA followed by unpaired t test with Welch's correction (A) and Kruskal–Wallis followed by uncorrected Dunn's multiple comparisons test (C). |