
Fig. 3
- ID
- ZDB-FIG-240816-26
- Publication
- Gaitán-Peñas et al., 2024 - Characterization of ClC-1 chloride channels in zebrafish: a new model to study myotonia
- Other Figures
- All Figure Page
- Back to All Figure Page
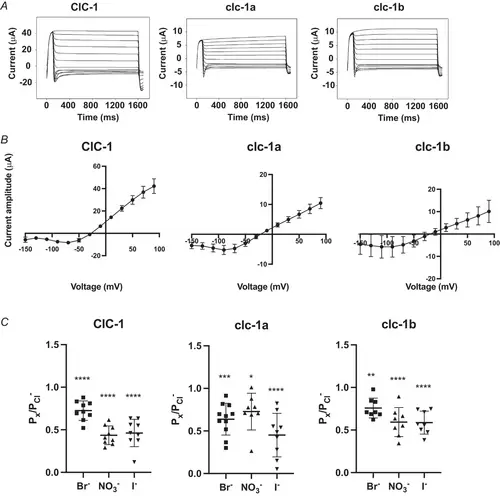
ZEBRAFISH CLC-1-MEDIATED CURRENTS IN XENOPUS OOCYTES A, representative current traces of human ClC-1 and zebrafish orthologues at pH 8.4. The voltage clamp protocol consisted of: 1500 ms voltage steps ranging from +90 mV to −150 mV in −20 mV increments. Each step was preceded by a 100 ms pre-pulse at +90 mV and followed by a 100 ms tail pulse at −90 mV. B, representative steady-state of current amplitude–voltage relationship of human ClC-1 (N = 5), clc-1a (N = 7) and clc-1b (N = 9). C, permeability ratios of Br−, NO3− and I− calculated for each clc-1 variant. Individual data points are depicted and means ± SD are shown. Ordinary one-way ANOVA with Tukey's multiple comparisons test was performed. For human ClC-1 (N = 9), permeability ratios of Br− (P = 0.71E-4), NO3− (P = 0.33E-10) and I− (P = 0.11E-9) were significantly different from Cl−. Similar results were found for clc-1a (N = 11) and clc-1b (N = 8): Br− (P = 0.32E-3 and P = 0.27E-2, respectively), NO3− (P = 0.02 and P = 0.21E-5, respectively) and I− (P = 0.74E-6 and P = 0.16E-5, respectively). Significance is shown as: **** P ≤ 0.0001, *** P ≤ 0.001, ** P ≤ 0.01, * P ≤ 0.05. |