
Fig. 8
- ID
- ZDB-IMAGE-240816-31
- Publication
- Gaitán-Peñas et al., 2024 - Characterization of ClC-1 chloride channels in zebrafish: a new model to study myotonia
- All Figures
- Figures for Gaitán-Peñas et al., 2024
|
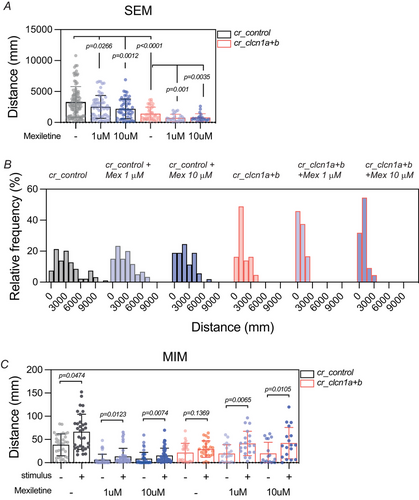
Fig. 8 MEXILETINE CAN RESCUE THE MIM PHENOTYPE IN THE CRISPANT ZEBRAFISH MYOTONIA MODEL A, total distance parameter recorded during the SEM test for each group. B, histogram showing the frequency of the distances travelled by each group during the SEM test. C, total distance parameter recorded during the MIM test for each group. In A and C, bars represent means ± SD of the total distance, where each dot represents a single larva (A; cr_control, n = 94; cr_control + mexiletine 1µm, n = 60; cr_control + mexiletine 10 um, n = 53; cr_clcn1a+b, n = 43; cr_clcn1a+b + mexiletine 1 µm, n = 24; cr_clcn1a+b + mexiletine 10 µm, n = 22. C; cr_control, n = 33; cr_control + mexiletine 1 µm, n = 38; cr_control + mexiletine 10 µm, n = 43; cr_clcn1a+b, n = 26; cr_clcn1a+b + mexiletine 1 µm, n = 20; cr_clcn1a+b + mexiletine 10 µm, n = 18). The graphs show the accumulation of 2−3 independent experiments (N = 2–3). Statistical analysis according to ordinary Brown-Forsythe ANOVA followed by unpaired t test with Welch's correction (A) and Kruskal–Wallis followed by uncorrected Dunn's multiple comparisons test (C).