
Fig. 6
- ID
- ZDB-IMAGE-240816-29
- Publication
- Gaitán-Peñas et al., 2024 - Characterization of ClC-1 chloride channels in zebrafish: a new model to study myotonia
- All Figures
- Figures for Gaitán-Peñas et al., 2024
|
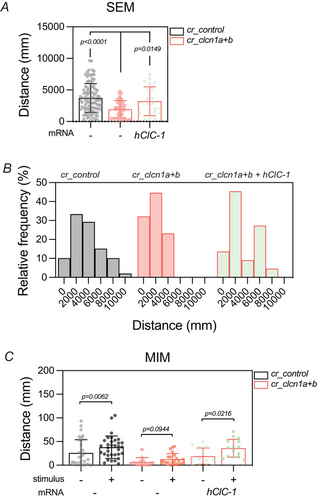
Fig. 6 CLCN1A AND CLCN1B CRISPANTS HAMPER BOTH SPONTANEOUS EXPLORATORY MOVEMENT (SEM) AND MECHANICALLY INDUCED MOVEMENT (MIM), AND BOTH ARE PARTIALLY RECOVERED BY TRANSIENT OVEREXPRESSION OF HCLC-1 A, total distance parameter recorded during the SEM test for both control (black border) and crispant (red border) groups. B, histogram showing the frequency of the distances travelled by each group during the SEM test. C, total distance parameter recorded during the MIM test for both control (black border) and crispant (red border) groups. In A and C, bars represent means ± SD of the total distance, where each dot represents a single larva (A; cr_control, n = 99; cr_clcn1a+b, n = 56; cr_clcn1a+b + hClC-1, n = 22. C; cr_control, n = 33; cr_clcn1a+b, n = 23; cr_clcn1a+b + hClC-1, n = 15). The graphs show the accumulation of 2−3 independent experiments (N = 2-3). Statistical analysis according to ordinary one-way ANOVA followed by uncorrected Fisher's LSD (A) or Kruskal–Wallis followed by uncorrected Dunn's multiple comparisons test (C). Source data are provided in a Source Data file.