
Fig. 7
- ID
- ZDB-IMAGE-240816-30
- Publication
- Gaitán-Peñas et al., 2024 - Characterization of ClC-1 chloride channels in zebrafish: a new model to study myotonia
- All Figures
- Figures for Gaitán-Peñas et al., 2024
|
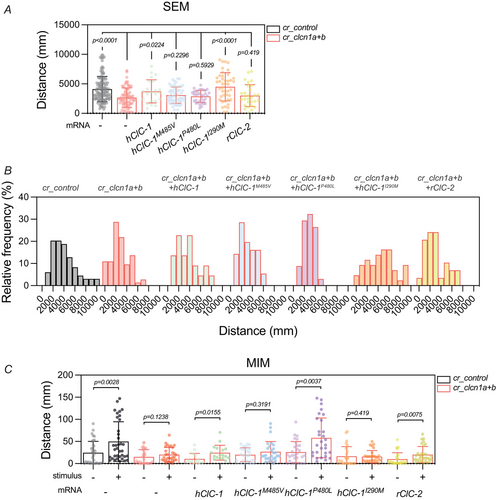
Fig. 7 RESCUE OF MOVEMENT DEFECTS BY MYTONIA MUTATIONS AND OTHER CLC CHANNELS A, total distance parameter recorded during the SEM test for each group. B, histogram showing the frequency of the distances travelled by each group during the SEM test. C, total distance parameter recorded during the MIM test for each group. In A and C, bars represent means ± SD of the total distance, where each dot represents a single larva (A; cr_control, n = 133; cr_clcn1a+b, n = 73; cr_clcn1a+b + hClC-1, n = 22; cr_clcn1a+b + hClC-1 M485V, n = 56; cr_clcn1a+b + hClC-1 P480L, n = 34; cr_clcn1a+b + hClC-1 I290M, n = 43; cr_clcn1a+b + rClC-2, n = 29. C; cr_control, n = 36; cr_clcn1a+b, n = 31; cr_clcn1a+b + hClC-1, n = 17; cr_clcn1a+b + hClC-1 M485V, n = 28; cr_clcn1a+b + hClC-1 P480L, n = 29; cr_clcn1a+b + hClC-1 I290M, n = 29; cr_clcn1a+b + rClC-2, n = 31). The graphs show the accumulation of 2−3 independent experiments (N = 2–3). Statistical analysis according to ordinary one-way ANOVA followed by uncorrected Fisher's LSD (A) or Kruskal–Wallis followed by uncorrected Dunn's multiple comparisons test