
Fig. 2
- ID
- ZDB-FIG-240816-25
- Publication
- Gaitán-Peñas et al., 2024 - Characterization of ClC-1 chloride channels in zebrafish: a new model to study myotonia
- Other Figures
- All Figure Page
- Back to All Figure Page
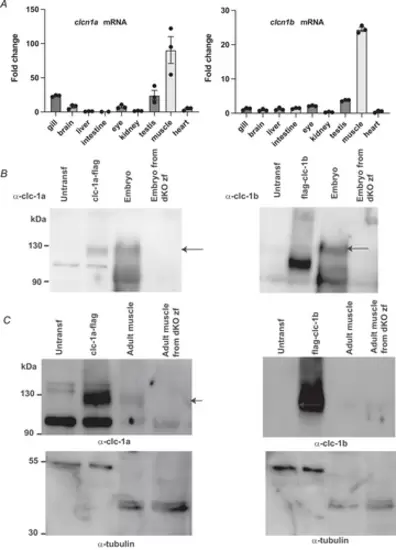
ZEBRAFISH CLCN1 GENE EXPRESSION AND PROTEIN DETECTIONA, relative clcn1 gene expression levels in adult tissues using real-time PCR. Bars indicate means ± SD. Both clcn1 orthologues show a marked preference for skeletal muscle expression. B, western blot detection of clc-1a and clc-1b protein levels in zebrafish embryos and HEK293T cells transfected with flag-tagged versions of both orthologues. Left, anti-flag detection in HEK293T transfected cells lysates. Centre, anti-clc-1a. Right, anti-clc-1b, polyclonal antibody detection in both zebrafish embryo and HEK293T transfected cell lysates. Lysates from dKO embryos were used to control antibody specificity. The specific band is indicated by an arrow. The difference in motility in the case of clc-1b is probably due to the presence of the flag tagged at the N terminus. When the flag tag was at the C-terminus of clc-1b, the protein was very unstable. C, western blot detection of clc-1a and clc-1b protein levels in both zebrafish adult muscle and HEK293T transfected cell lysates with (left) anti-clc-1a and (right) anti-clc-1b, polyclonal antibodies. Lysates from dKO embryos were used to control antibody specificity. The specific band is indicated by an arrow. The detection of tubulin was used as a loading control. Note that tubulin has a different size in HEK transfected cells compared with zebrafish. |