
- Title
-
Therapeutic liposomal combination to enhance chemotherapy response and immune activation of tumor microenvironment
- Authors
- Gu, Z., Yin, J., Da Silva, C.G., Liu, Q., Cruz, L.J., Ossendorp, F., Snaar-Jagalska, E.
- Source
- Full text @ J. Control Release
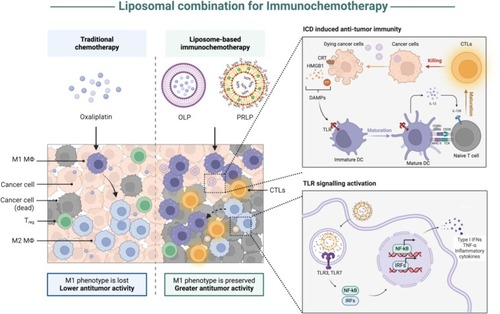
Illustration of the liposome-mediated immunochemotherapy. Neutral liposomes carried oxaliplatin (OLP) kill cancer cells directly and induce immunogenic cell death (ICD), which provide potent pro-inflammatory signals for DCs to be activated and recruited from the lymph nodes. This process initiates the anti-tumor immunity and employs effector T cells in the tumor tissue. Meanwhile, the stimulation of the TLR pathway by PRLP liposomes leads to the release of cytokines such as IL-12, IFN-γ, TNF-α, etc., which also aims to polarize the tumor-associated macrophages towards the pro-inflammatory M1 subtype. The engagement of M1 macrophages and effector T cells in the TME can inhibit tumor growth more effectively and overcomes oxaliplatin resistance mechanisms in CT26-tumor bearing mice. |
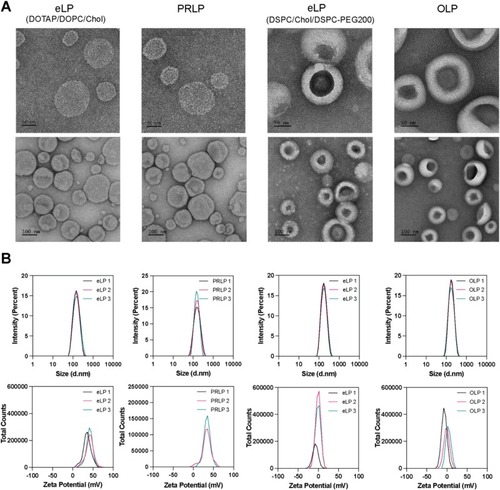
Characterization of liposomes. A. The TEM photos of different liposomes: empty liposomes (eLP); pIC and R848-loaded liposomes (PRLP); oxaliplatin-loaded liposomes (OLP). B. Size and zeta potential distribution of different liposomes. |
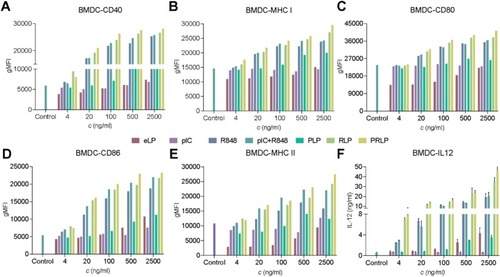
BMDC maturation after free TLR agonist and liposomal treatments after 24 h. A. The expression of CD40. B. The expression of MHC I. C. The expression of CD80. D. The expression of CD86. E. The expression of MHC II. F. The release of IL-12. (eLP: empty liposomes (cationic); pIC: poly (I:C), PLP: pIC-loaded liposome, RLP: R848-loaded liposome; PRLP: pIC and R848 co-loaded). |
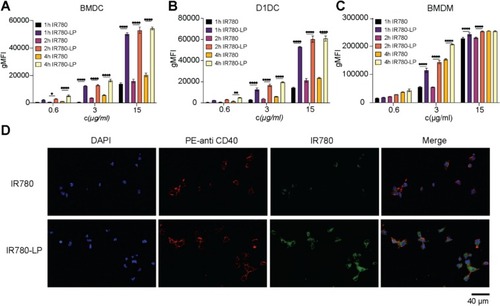
Cellular internalization of liposomes. A. Quantification of intracellular uptake of free IR780 and IR780-LP in BMDC. B. Quantification of intracellular uptake of free IR780 and IR780-LP in D1DC. C. Quantification of intracellular uptake of free IR780 and IR780-LP in BMDM. (n = 3, results were shown in mean ± S.D., *, p < 0.05, **, p < 0.01, ***, p < 0.001, ****, p < 0.0001). D. Fluorescent photos of D1DC after incubated with free IR780 or IR780-LP for 4 h. (blue color indicates nuclei staining with DAPI, red color indicates membrane staining with PE-labeled anti-CD40, green color indicated liposome location in the cytoplasm, scale bar = 40 μm). (For interpretation of the references to color in this figure legend, the reader is referred to the web version of this article.) |

Apoptosis, immunogenic cell death, and phagocytosis of macrophages. A. Quantification of apoptosis in CT26 cells after incubated with different oxaliplatin formulations for 48 h. B. The calreticulin expression of CT26 cell after 48-h treatment. C. The HSP70 expression of CT26 cell after 8-h treatment. D. The HSP90 expression of CT26 cell after 48-h treatment. E. The phagocytosis of M1 and M2 macrophages after 24-h incubation with pre-treated CT26 cells. F. The phagocytosis of M2 macrophages after 24-h incubation with TLR agonist and pre-treated CT26 cells. (n = 3, results are shown in mean ± S.D., *, p < 0.05, **, p < 0.01, and ***, p < 0.001). |
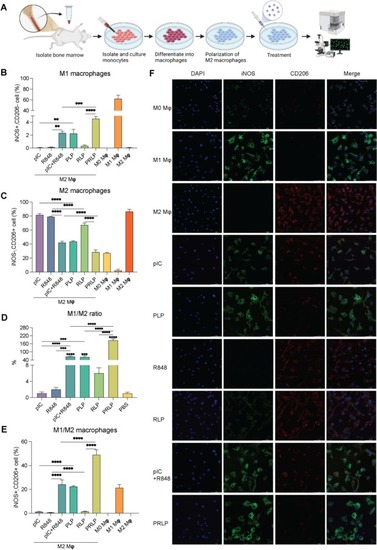
Macrophage re-polarization in vitro. A. Schematic illustration of treatment on BMDM. B. The total number of M1 macrophages (iNOS+CD206−) post treatment. C. The total number of M2 macrophages (iNOS−CD206+) post treatment. D. M1/M2 ratio of BMDM post treatment. E. The total number of M1/M2 macrophages (iNOS+CD206+) post treatment. F. Confocal photos of BMDM post treatment. (Scale bar = 40 μm). (n = 3, results were shown in mean ± S.D., *, p < 0.05, **, p < 0.01, ***, p < 0.001, ****, p < 0.0001). |
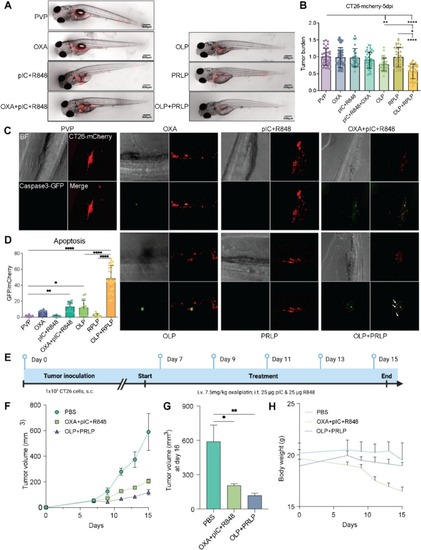
Efficiency of different formulations in CT26 cancer models in vivo. A. Representative fluorescent images of CT26 tumor burden (red dots) in zebrafish embryos after different treatment. B The relative fluorescence intensity of CT26 tumor burden receiving different treatments at 5 dpi. C. Representative overlay apoptotic images (yellow dots) of embryos. D. Quantification of the number of apoptotic tumor cells. (Experiment was performed 3 times with a group size of 10 embryos.) E. Schedule of tumor cells injection and treatment on mice. F. The tumor growth curve of CT26 tumor-bearing mice after multiple treatments (n = 4). G. The tumor volume of CT26 tumor-bearing mice at day 16 after multiple treatments (n = 4). H. Average changes of mice body weight after multiple treatments (n = 4, results were shown in mean ± S.D., *, p < 0.05, **, p < 0.01). (For interpretation of the references to color in this figure legend, the reader is referred to the web version of this article.) |
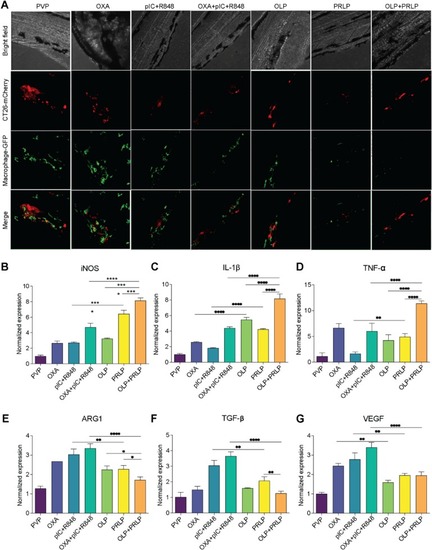
Macrophages recruitment and cytokine release in zebrafish xenografts. A. Representative images of CT26 (in red) and macrophages (in green) in zebrafish xenografts at 5 dpi. B. Quantitative qPCR analysis for iNOS of zebrafish xenograft at 5 dpi. C. Quantitative qPCR analysis for IL-1β of zebrafish xenograft at 5 dpi. D. Quantitative qPCR analysis for TNF-α of zebrafish xenograft at 5 dpi. E. Quantitative qPCR analysis for ARG2 of zebrafish xenograft at 5 dpi. F. Quantitative qPCR analysis for TGF-β of zebrafish xenograft at 5 dpi. G. Quantitative qPCR analysis for VEGF of zebrafish xenograft at 5 dpi. (n = 3, results were shown in mean ± S.D., *, p < 0.05, **, p < 0.01, p < 0.01, ***, p < 0.001, ****, p < 0.0001). (For interpretation of the references to color in this figure legend, the reader is referred to the web version of this article.) |
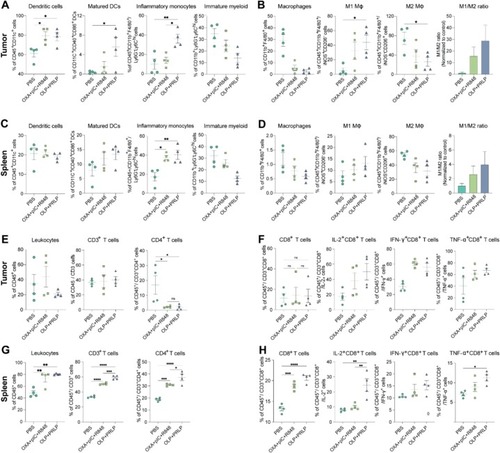
Anti-tumor immunity evaluation in CT26-tumor bearing mice. A. The percentage of DCs, matured DC, inflammatory monocytes and immature myeloid cells in the TME after treatments. B. The percentage of macrophages, M1 macrophages, M2 macrophages and M1/M2 ratio in the TME after treatments. C. The percentage of DCs, matured DC, inflammatory monocytes and immature myeloid cells in the spleen after treatments. D. The percentage of macrophages, M1 macrophages, M2 macrophages and M1/M2 ratio in the spleen after treatments. E. The percentage of leukocytes, CD3+ T cells and CD4+ T cells in the TME after treatments. F. The percentage of CD8+ T cells, IL-2+CD8+ T cells, IFN-γ+CD8+ T cells and TNF-α+CD8+ T cells in the TME after treatments. G. The percentage of leukocytes, CD3+ T cells and CD4+ T cells in the spleen after treatments. F. The percentage of CD8+ T cells, IL-2+CD8+ T cells, IFN-γ+CD8+ T cells and TNF-α+CD8+ T cells in the spleen after treatments. (n = 4, results were shown in mean ± S.D., *, p < 0.05, **, p < 0.01, p < 0.01, ***, p < 0.001, ****, p < 0.0001). |