
|
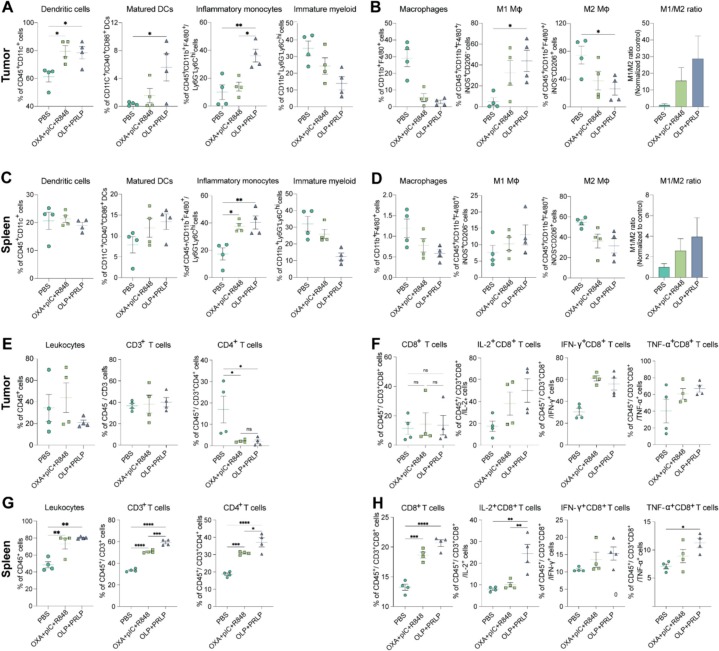
Fig. 9 Anti-tumor immunity evaluation in CT26-tumor bearing mice. A. The percentage of DCs, matured DC, inflammatory monocytes and immature myeloid cells in the TME after treatments. B. The percentage of macrophages, M1 macrophages, M2 macrophages and M1/M2 ratio in the TME after treatments. C. The percentage of DCs, matured DC, inflammatory monocytes and immature myeloid cells in the spleen after treatments. D. The percentage of macrophages, M1 macrophages, M2 macrophages and M1/M2 ratio in the spleen after treatments. E. The percentage of leukocytes, CD3+ T cells and CD4+ T cells in the TME after treatments. F. The percentage of CD8+ T cells, IL-2+CD8+ T cells, IFN-γ+CD8+ T cells and TNF-α+CD8+ T cells in the TME after treatments. G. The percentage of leukocytes, CD3+ T cells and CD4+ T cells in the spleen after treatments. F. The percentage of CD8+ T cells, IL-2+CD8+ T cells, IFN-γ+CD8+ T cells and TNF-α+CD8+ T cells in the spleen after treatments. (n = 4, results were shown in mean ± S.D., *, p < 0.05, **, p < 0.01, p < 0.01, ***, p < 0.001, ****, p < 0.0001).