
Fig. 7
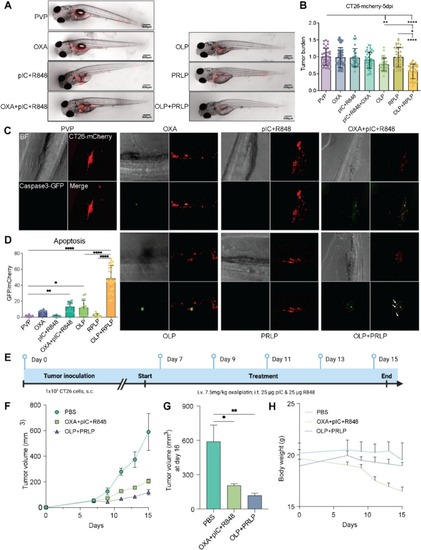
Efficiency of different formulations in CT26 cancer models in vivo. A. Representative fluorescent images of CT26 tumor burden (red dots) in zebrafish embryos after different treatment. B The relative fluorescence intensity of CT26 tumor burden receiving different treatments at 5 dpi. C. Representative overlay apoptotic images (yellow dots) of embryos. D. Quantification of the number of apoptotic tumor cells. (Experiment was performed 3 times with a group size of 10 embryos.) E. Schedule of tumor cells injection and treatment on mice. F. The tumor growth curve of CT26 tumor-bearing mice after multiple treatments (n = 4). G. The tumor volume of CT26 tumor-bearing mice at day 16 after multiple treatments (n = 4). H. Average changes of mice body weight after multiple treatments (n = 4, results were shown in mean ± S.D., *, p < 0.05, **, p < 0.01). (For interpretation of the references to color in this figure legend, the reader is referred to the web version of this article.) |