
FIGURE
Fig. 6
Fig. 6
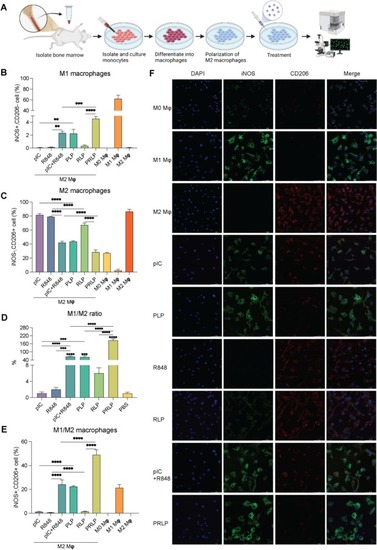
Macrophage re-polarization in vitro. A. Schematic illustration of treatment on BMDM. B. The total number of M1 macrophages (iNOS+CD206−) post treatment. C. The total number of M2 macrophages (iNOS−CD206+) post treatment. D. M1/M2 ratio of BMDM post treatment. E. The total number of M1/M2 macrophages (iNOS+CD206+) post treatment. F. Confocal photos of BMDM post treatment. (Scale bar = 40 μm). (n = 3, results were shown in mean ± S.D., *, p < 0.05, **, p < 0.01, ***, p < 0.001, ****, p < 0.0001). |
Expression Data
Expression Detail
Antibody Labeling
Phenotype Data
Phenotype Detail
Acknowledgments
This image is the copyrighted work of the attributed author or publisher, and
ZFIN has permission only to display this image to its users.
Additional permissions should be obtained from the applicable author or publisher of the image.
Full text @ J. Control Release