
Fig. 4
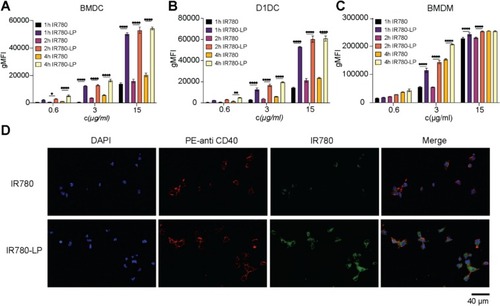
Cellular internalization of liposomes. A. Quantification of intracellular uptake of free IR780 and IR780-LP in BMDC. B. Quantification of intracellular uptake of free IR780 and IR780-LP in D1DC. C. Quantification of intracellular uptake of free IR780 and IR780-LP in BMDM. (n = 3, results were shown in mean ± S.D., *, p < 0.05, **, p < 0.01, ***, p < 0.001, ****, p < 0.0001). D. Fluorescent photos of D1DC after incubated with free IR780 or IR780-LP for 4 h. (blue color indicates nuclei staining with DAPI, red color indicates membrane staining with PE-labeled anti-CD40, green color indicated liposome location in the cytoplasm, scale bar = 40 μm). (For interpretation of the references to color in this figure legend, the reader is referred to the web version of this article.) |