
Fig. 8
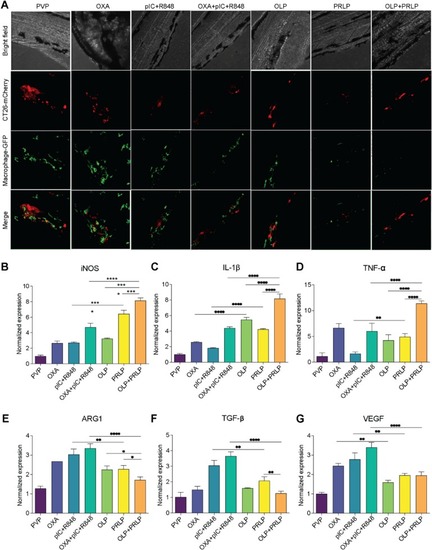
Macrophages recruitment and cytokine release in zebrafish xenografts. A. Representative images of CT26 (in red) and macrophages (in green) in zebrafish xenografts at 5 dpi. B. Quantitative qPCR analysis for iNOS of zebrafish xenograft at 5 dpi. C. Quantitative qPCR analysis for IL-1β of zebrafish xenograft at 5 dpi. D. Quantitative qPCR analysis for TNF-α of zebrafish xenograft at 5 dpi. E. Quantitative qPCR analysis for ARG2 of zebrafish xenograft at 5 dpi. F. Quantitative qPCR analysis for TGF-β of zebrafish xenograft at 5 dpi. G. Quantitative qPCR analysis for VEGF of zebrafish xenograft at 5 dpi. (n = 3, results were shown in mean ± S.D., *, p < 0.05, **, p < 0.01, p < 0.01, ***, p < 0.001, ****, p < 0.0001). (For interpretation of the references to color in this figure legend, the reader is referred to the web version of this article.) |