
- Title
-
Meningeal lymphatic supporting cells govern the formation and maintenance of zebrafish mural lymphatic endothelial cells
- Authors
- He, X., Xiong, D., Zhao, L., Fu, J., Luo, L.
- Source
- Full text @ Nat. Commun.
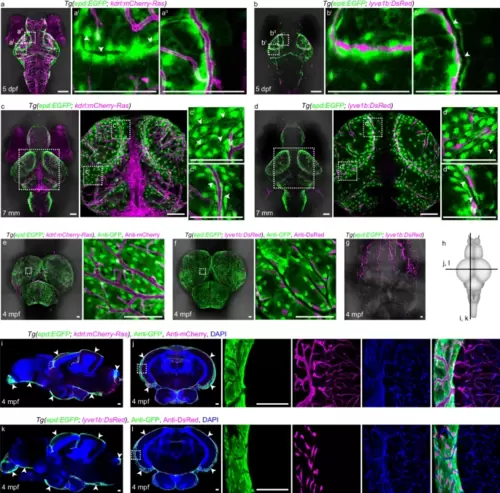
The epd-positive cells in zebrafish leptomeninges consistently enwrap muLECs from larva to adult.a, c, e Dorsal confocal images of epd-positive cells and blood vessels on Tg(epd:EGFP; kdrl:mCherry-Ras) brains at 5 dpf (a n = 20), 7 mm (c n = 20) and 4 mpf (e n = 12). White arrowheads indicate the cavities of mural lymphatic endothelial cells (muLECs). b, d, f Dorsal confocal images of epd-positive cells and muLECs on Tg(epd:EGFP; lyve1b:DsRed) brains at 5 dpf (b n = 20), 7 mm (d n = 20) and 4 mpf (f n = 12). White arrowheads indicate the cavities of meningeal blood vessels. g A representative confocal image of the meningeal lymphatics in the dura mater beneath the skull at 4 mpf. n = 12. h Illustration of cross-sections (horizontal line) and sagittal sections (vertical line) of adult zebrafish brain in (i–l). i–l Confocal images of brain sections showing the locations of epd-positive cells in the leptomeninges at 4 mpf. White arrowheads indicate the distributions of epd-positive cells. n = 12 adult brains per experiment. Each experiment was repeated three times independently with similar results. The white dashed boxes outline the enlarged areas. Scale bars: 100 µm. |
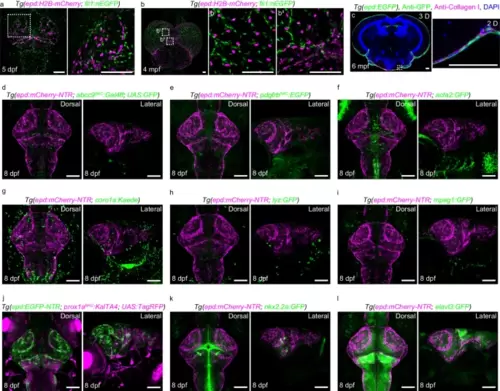
The epd-positive cells do not belong to other known meningeal cell types.a, b Dorsal confocal images of epd:H2B-mCherry-positive nuclei and fli1:nEFP-positive nuclei in Tg(epd:H2B-mCherry; fli1:nEFP) brains at 5 dpf (a n = 20) and 4 mpf (b n = 8). c Confocal image of a cross-section of an adult brain showing collagen I-labeled fibroblasts at a different layer to epd-positive cells at 6 mpf. A 2D view of the enlarged area is shown. n = 8 adult brains. The experiment was repeated three times independently with similar results. d–l Confocal images showed epd-positive cells did not co-stain with abcc9BAC:Gal4ff; UAS:GFP-positive pericytes (d), pdgfrbBAC:EGFP-positive pericytes (e), acta2:GFP-positive smooth muscle cells (f), coro1a:Kaede-positive immune cells (g), lyz:GFP-positive neutrophils (h), mpeg1:GFP-positive macrophages (i), prox1aBAC:KalTA4; UAS:TagRFP-positive lymphatic endothelial cells and neuronal cells (j), nkx2.2a:GFP-positive neuronal and/or oligodendrocytes (k), and elavl3:GFP-positive neurons (l) at 8 dpf. Dorsal and lateral views of the larval brains were shown. n = 20 per experiment. Each experiment was repeated three times independently with similar results. The white dashed boxes outline the enlarged areas. Scale bars: 100 µm. |
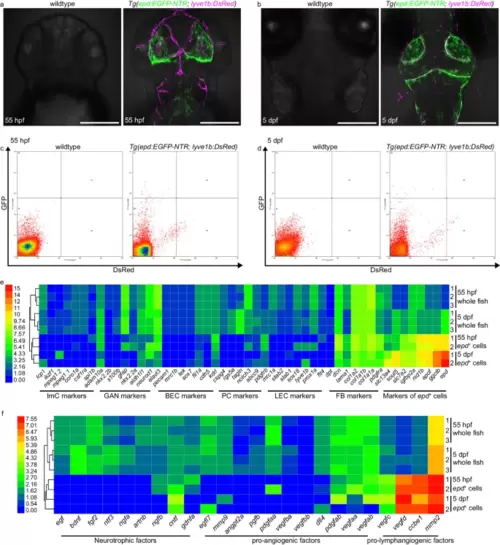
The epd-positive cells express unique markers and produce pro-lymphangiogenic factors at embryonic/larval stages.a, b Dorsal confocal images of fluorescence-negative wild-type and Tg(epd:EGFP-NTR; lyve1b:DsRed) embryonic/larval brains at 55 hpf (a) and 5 dpf (b). n = 30 embryos/larvae per panel. Scale bars: 200 µm. c, d Representative plots for fluorescence-activated cell (FAC) sorted EGFP-NTR-positive cells in brains of fluorescence-negative wild-type and Tg(epd:EGFP-NTR; lyve1b:DsRed) at 55 hpf (c) and 5 dpf (d). e Heatmap for differential expression levels of epd-positive cells and other selected known meningeal cell marker genes between whole fish (n = 100 fish per replicate) and FAC sorted epd-positive cells (EGFP-NTR-positive, n = 100 cells per replicate). ImC immune cell, GAN glial and neural cells, BEC blood vessel endothelial cell, PC pericytes, LEC lymphatic endothelial cell, FB fibroblasts, epd+ cells epd-positive cells. Scale bar represents relative expression by log2(FPKM + 1), from 0 (lowest) to 15 (highest). f Heatmap for differential expression levels of neurotrophic, pro-angiogenic, and pro-lymphangiogenic factors between whole fish (n = 100 fish per replicate) and FAC sorted epd-positive cells (EGFP-NTR-positive, n = 100 cells per replicate). Scale bar represents relative expression by log2(FPKM + 1), from 0 (lowest) to 7.55 (highest). |
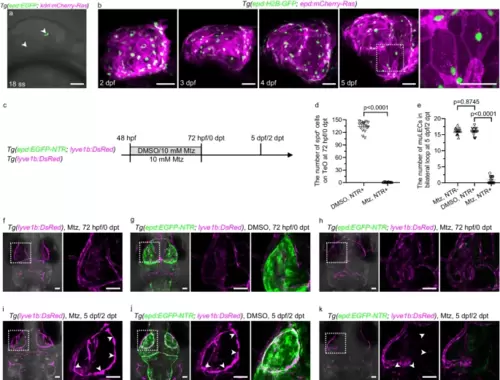
The epd-positive cells are required for the development of early muLECs.a A representative lateral confocal image of epd-positive cells first appeared in Tg(epd:EGFP; kdrl:mCherry-Ras) brains at 18-somite stage (ss). White arrowheads indicate the epd-positive cells. n = 10. The experiment was repeated three times independently with similar results. b Lateral confocal images of the development of epd-positive cells in Tg(epd:H2B-GFP; epd:mCherry-Ras) from 2 dpf to 5 dpf. The nuclei and membranes of epd-positive cells are labeled with H2B-GFP and mCherry-Ras, respectively. Enlarged area showing irregular spindle-shaped epd-positive single-cell. n = 15 per stage. c Schematic diagram showing the strategy for ablation of epd-positive cells. d, e Quantification of the number of epd-positive cells on the optic tectum (TeO) at 72 hpf/0 dpt (d) and the number of mural lymphatic endothelial cells (muLECs) in bilateral loop at 5 dpf/2 dpt (e) in the nonablation and epd-positive cell ablation group. 16 fish were observed in three independent experiments in each group. f, g, i, j Dorsal confocal images of epd-positive cells and muLECs in brains that did not induce muLEC or epd-positive cell injury at 72 hpf/0 dpt and 5 dpf/2 dpt. White arrowheads indicate muLECs. n = 34 per experiment. h Dorsal confocal images of ablation of epd-positive cells in brains at 72 hpf/0 dpt. n = 38. The experiment was repeated three times independently with similar results. k Dorsal confocal images of massive missing in muLECs after epd-positive cell ablation at 5 dpf/2 dpt. White arrowheads indicate where the muLECs should have been. n = 33. The experiment was repeated three times independently with similar results. Error bars, mean ± SEM. Unpaired two-tailed Student’s t-test. P values included in the graphs. Source data are provided as a Source Data file. The white dashed boxes outline the enlarged areas. Scale bars: 50 µm. |
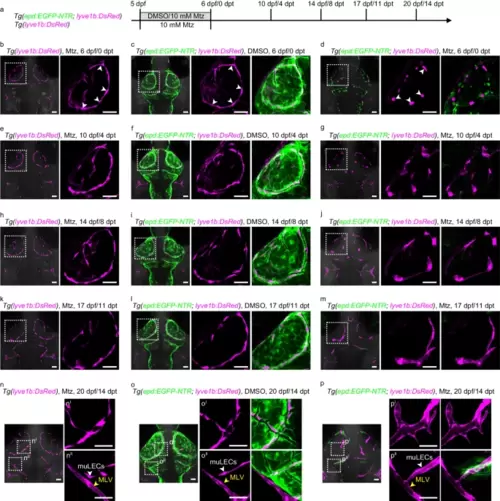
The mLSCs are essential for maintaining the dispersed distribution pattern of muLECs at the larval stage.a Schematic diagram showing experimental design for meningeal lymphatic supporting cell (mLSC) ablation. b, c, e, f, h, i, k, l, n, o Dorsal confocal images of mural lymphatic endothelial cells (muLECs) and mLSCs in brains that did not induce muLEC or mLSC injury at 6 dpf/0 dpt, 10 dpf/4 dpt, 14 dpf/8 dpt, 17 dpf/11 dpt and 20 dpf/14 dpt. White arrowheads indicate muLECs. Yellow arrowheads indicate meningeal lymphatic vessels (MLV). n = 20 per experiment. d, g, j, m, p Dorsal confocal images showing the progressive formation of lymphatic vessels from collapsed muLECs after inducing injury to mLSCs. White arrowheads in (d) indicate collapsed muLECs. White arrowheads in (p) indicate muLEC-derived lymphatic vessels. Yellow arrowheads indicate MLV. d n = 28; g n = 24; j n = 20; m n = 17; p n = 19. The experiments were repeated three times independently with similar results. The white dashed boxes outline the enlarged areas. Scale bars: 50 µm. |
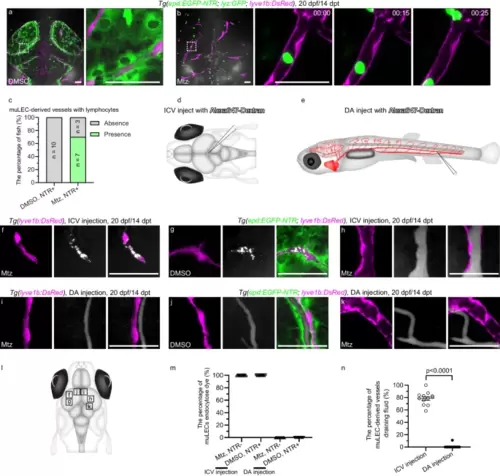
The muLEC-derived lymphatic vessels perform the functions of transporting immune cells and draining cerebrospinal fluid.a Dorsal confocal images of lyz:GFP+ lymphocytes in DMSO-treated brains at 20 dpf/14 dpt. n = 6. b Time-lapse images of the flow of lyz:GFP+ lymphocytes in mural lymphatic endothelial cell (muLEC)-derived lymphatic vessels of Mtz-treated brains at 20 dpf/14 dpt. The duration of time-lapse imaging is represented in hours:minutes. n = 6. The experiment was repeated three times independently with similar results. c Percentage of fish whose muLEC-derived vessels with (green) and without (gray) immune cells. 10 fish were observed in three independent experiments in each group. d, e, l Illustrations of intracerebroventricular (ICV) and dorsal aorta (DA) injection points of Alexa647-dextran and image areas. f, g Confocal images of the uptake of Alexa647-dextran by muLECs in meningeal lymphatic supporting cell (mLSC)-uninjured brains after ICV injection. n = 20 per experiment. Each experiment was repeated three times independently with similar results. h Confocal images of the uptake of Alexa647-dextran by muLEC-derived lymphatic vessels in mLSC-injured brains after ICV injection. n = 17. The experiment was repeated three times independently with similar results. i, j Confocal images of the uptake of Alexa647-dextran by blood vessels in mLSC-uninjured brains after DA injection. n = 14 per group. Each experiment was repeated three times independently with similar results. k Confocal images of the flow of Alexa647-dextran in blood vessels but not muLEC-derived lymphatic vessels in mLSC-injured brains after DA injection. n = 14. The experiment was repeated three times independently with similar results. m, n Quantification of the number of muLECs endocytosed dye as a percentage of total muLECs (m) and the length of muLEC-derived vessels draining fluid as a percentage of total muLEC-derived vessels (n) after ICV or DA injection of Alexa647-dextran. 12 fish were observed in three independent experiments in each group. Error bars, mean ± SEM. Unpaired two-tailed Student’s t-test. P values included in the graphs. Source data are provided as a Source Data file. The white dashed boxes outline the enlarged areas. Scale bars: 50 µm. |
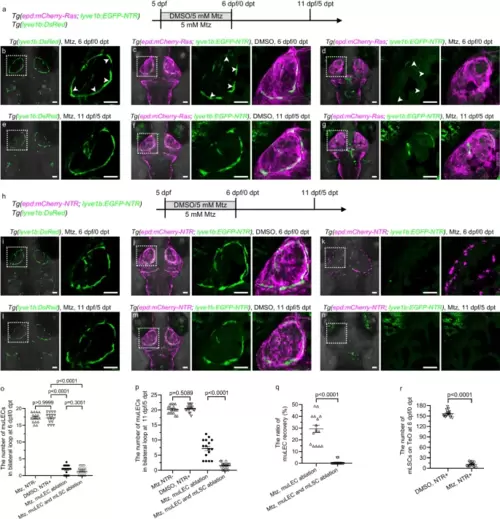
The mLSCs are necessary for the regeneration of muLECs after injury.a, h Experimental design for ablation of meningeal lymphatic supporting cells (mLSCs) and mural lymphatic endothelial cells (muLECs). b, c, e, f, i, j, l, m Dorsal confocal images of muLECs and mLSCs in unablated brains at 6 dpf/0 dpt and 11 dpf/5 dpt. n = 37 per experiment. White arrowheads indicate muLECs. d Dorsal confocal images of muLEC ablation at 6 dpf/0 dpt. White arrowheads indicate muLECs after ablation. n = 37. The experiment was repeated three times independently with similar results. g Dorsal confocal image of partial regeneration of muLECs after injury at 11 dpf/5 dpt. n = 28. The experiment was repeated three times independently with similar results. k Dorsal confocal images of muLEC and mLSC ablation at 6 dpf/0 dpt. n = 39. The experiment was repeated three times independently with similar results. n Dorsal confocal images of less regeneration of muLECs after muLEC and mLSC ablation at 11 dpf/5 dpt. n = 34. The experiment was repeated three times independently with similar results. o, p Quantification of the number of muLECs in bilateral loop in the nonablation, muLEC ablation, and muLEC and mLSC double ablation larvae at 6 dpf/0 dpt (o) and at 11 dpf/5 dpt (p). 16 fish were observed in three independent experiments in each group. q Quantification of the recovery rate of muLECs in bilateral loop after muLEC ablation and double muLEC and mLSC ablation. 16 fish were observed in three independent experiments in each group. The same larvae as in (o, p) were used. r Quantification of the number of mLSCs on the optic tectum (TeO) for larvae with unablated and ablated mLSCs at 6 dpf/0 dpt. 16 fish were observed in three independent experiments in each group. Error bars, mean ± SEM. Unpaired two-tailed Student’s t-test. P values included in the graphs. Source data are provided as a Source Data file. The white dashed boxes outline the enlarged areas. Scale bar: 50 µm. |