
Fig. 4
- ID
- ZDB-FIG-240703-111
- Publication
- He et al., 2024 - Meningeal lymphatic supporting cells govern the formation and maintenance of zebrafish mural lymphatic endothelial cells
- Other Figures
- All Figure Page
- Back to All Figure Page
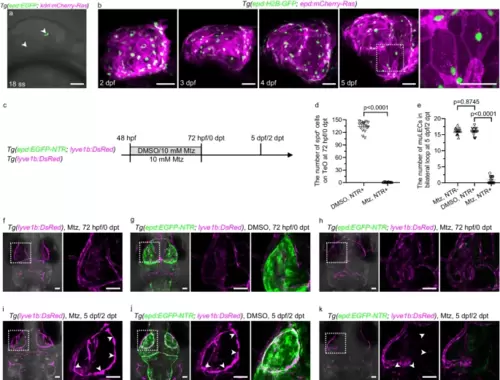
The epd-positive cells are required for the development of early muLECs.a A representative lateral confocal image of epd-positive cells first appeared in Tg(epd:EGFP; kdrl:mCherry-Ras) brains at 18-somite stage (ss). White arrowheads indicate the epd-positive cells. n = 10. The experiment was repeated three times independently with similar results. b Lateral confocal images of the development of epd-positive cells in Tg(epd:H2B-GFP; epd:mCherry-Ras) from 2 dpf to 5 dpf. The nuclei and membranes of epd-positive cells are labeled with H2B-GFP and mCherry-Ras, respectively. Enlarged area showing irregular spindle-shaped epd-positive single-cell. n = 15 per stage. c Schematic diagram showing the strategy for ablation of epd-positive cells. d, e Quantification of the number of epd-positive cells on the optic tectum (TeO) at 72 hpf/0 dpt (d) and the number of mural lymphatic endothelial cells (muLECs) in bilateral loop at 5 dpf/2 dpt (e) in the nonablation and epd-positive cell ablation group. 16 fish were observed in three independent experiments in each group. f, g, i, j Dorsal confocal images of epd-positive cells and muLECs in brains that did not induce muLEC or epd-positive cell injury at 72 hpf/0 dpt and 5 dpf/2 dpt. White arrowheads indicate muLECs. n = 34 per experiment. h Dorsal confocal images of ablation of epd-positive cells in brains at 72 hpf/0 dpt. n = 38. The experiment was repeated three times independently with similar results. k Dorsal confocal images of massive missing in muLECs after epd-positive cell ablation at 5 dpf/2 dpt. White arrowheads indicate where the muLECs should have been. n = 33. The experiment was repeated three times independently with similar results. Error bars, mean ± SEM. Unpaired two-tailed Student’s t-test. P values included in the graphs. Source data are provided as a Source Data file. The white dashed boxes outline the enlarged areas. Scale bars: 50 µm. |