
|
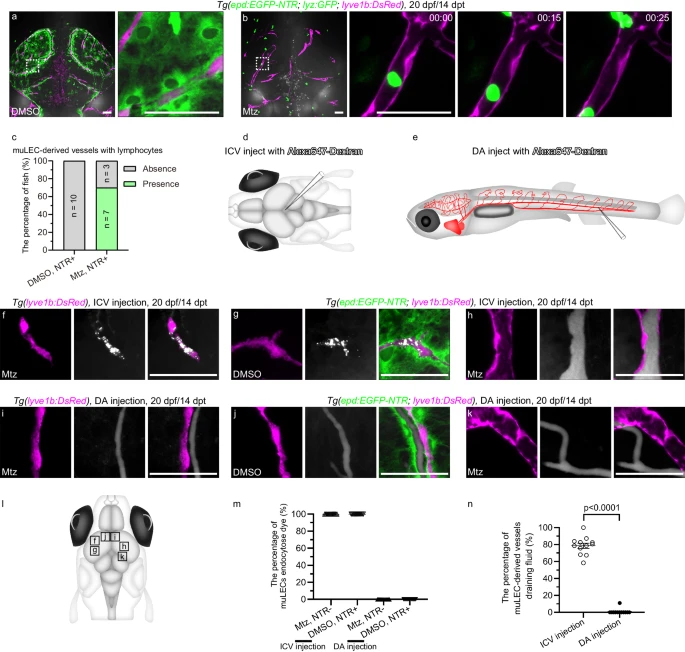
Fig. 6 The muLEC-derived lymphatic vessels perform the functions of transporting immune cells and draining cerebrospinal fluid.a Dorsal confocal images of lyz:GFP+ lymphocytes in DMSO-treated brains at 20 dpf/14 dpt. n = 6. b Time-lapse images of the flow of lyz:GFP+ lymphocytes in mural lymphatic endothelial cell (muLEC)-derived lymphatic vessels of Mtz-treated brains at 20 dpf/14 dpt. The duration of time-lapse imaging is represented in hours:minutes. n = 6. The experiment was repeated three times independently with similar results. c Percentage of fish whose muLEC-derived vessels with (green) and without (gray) immune cells. 10 fish were observed in three independent experiments in each group. d, e, l Illustrations of intracerebroventricular (ICV) and dorsal aorta (DA) injection points of Alexa647-dextran and image areas. f, g Confocal images of the uptake of Alexa647-dextran by muLECs in meningeal lymphatic supporting cell (mLSC)-uninjured brains after ICV injection. n = 20 per experiment. Each experiment was repeated three times independently with similar results. h Confocal images of the uptake of Alexa647-dextran by muLEC-derived lymphatic vessels in mLSC-injured brains after ICV injection. n = 17. The experiment was repeated three times independently with similar results. i, j Confocal images of the uptake of Alexa647-dextran by blood vessels in mLSC-uninjured brains after DA injection. n = 14 per group. Each experiment was repeated three times independently with similar results. k Confocal images of the flow of Alexa647-dextran in blood vessels but not muLEC-derived lymphatic vessels in mLSC-injured brains after DA injection. n = 14. The experiment was repeated three times independently with similar results. m, n Quantification of the number of muLECs endocytosed dye as a percentage of total muLECs (m) and the length of muLEC-derived vessels draining fluid as a percentage of total muLEC-derived vessels (n) after ICV or DA injection of Alexa647-dextran. 12 fish were observed in three independent experiments in each group. Error bars, mean ± SEM. Unpaired two-tailed Student’s t-test. P values included in the graphs. Source data are provided as a Source Data file. The white dashed boxes outline the enlarged areas. Scale bars: 50 µm.