
Fig. 7
- ID
- ZDB-FIG-240703-114
- Publication
- He et al., 2024 - Meningeal lymphatic supporting cells govern the formation and maintenance of zebrafish mural lymphatic endothelial cells
- Other Figures
- All Figure Page
- Back to All Figure Page
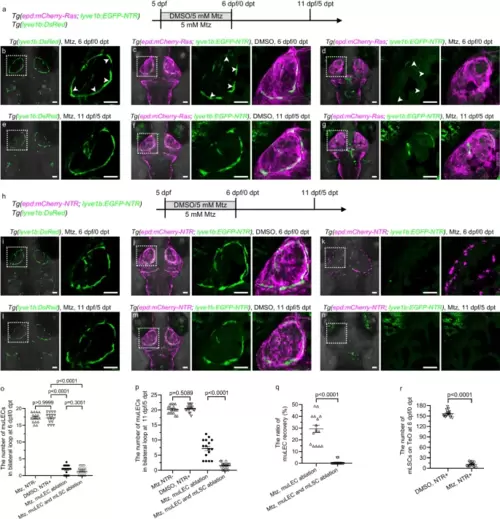
The mLSCs are necessary for the regeneration of muLECs after injury.a, h Experimental design for ablation of meningeal lymphatic supporting cells (mLSCs) and mural lymphatic endothelial cells (muLECs). b, c, e, f, i, j, l, m Dorsal confocal images of muLECs and mLSCs in unablated brains at 6 dpf/0 dpt and 11 dpf/5 dpt. n = 37 per experiment. White arrowheads indicate muLECs. d Dorsal confocal images of muLEC ablation at 6 dpf/0 dpt. White arrowheads indicate muLECs after ablation. n = 37. The experiment was repeated three times independently with similar results. g Dorsal confocal image of partial regeneration of muLECs after injury at 11 dpf/5 dpt. n = 28. The experiment was repeated three times independently with similar results. k Dorsal confocal images of muLEC and mLSC ablation at 6 dpf/0 dpt. n = 39. The experiment was repeated three times independently with similar results. n Dorsal confocal images of less regeneration of muLECs after muLEC and mLSC ablation at 11 dpf/5 dpt. n = 34. The experiment was repeated three times independently with similar results. o, p Quantification of the number of muLECs in bilateral loop in the nonablation, muLEC ablation, and muLEC and mLSC double ablation larvae at 6 dpf/0 dpt (o) and at 11 dpf/5 dpt (p). 16 fish were observed in three independent experiments in each group. q Quantification of the recovery rate of muLECs in bilateral loop after muLEC ablation and double muLEC and mLSC ablation. 16 fish were observed in three independent experiments in each group. The same larvae as in (o, p) were used. r Quantification of the number of mLSCs on the optic tectum (TeO) for larvae with unablated and ablated mLSCs at 6 dpf/0 dpt. 16 fish were observed in three independent experiments in each group. Error bars, mean ± SEM. Unpaired two-tailed Student’s t-test. P values included in the graphs. Source data are provided as a Source Data file. The white dashed boxes outline the enlarged areas. Scale bar: 50 µm. |