
Fig. 3
- ID
- ZDB-FIG-240703-110
- Publication
- He et al., 2024 - Meningeal lymphatic supporting cells govern the formation and maintenance of zebrafish mural lymphatic endothelial cells
- Other Figures
- All Figure Page
- Back to All Figure Page
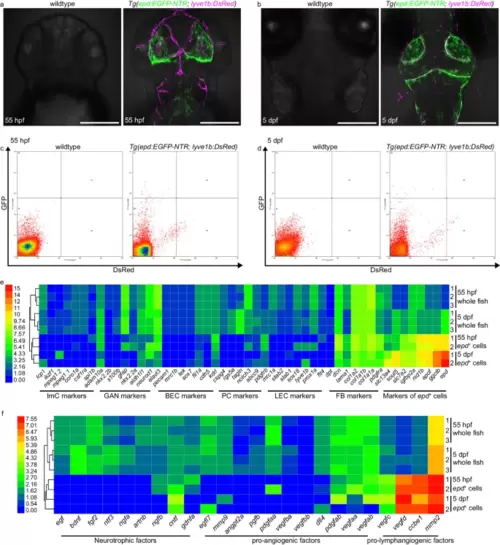
The epd-positive cells express unique markers and produce pro-lymphangiogenic factors at embryonic/larval stages.a, b Dorsal confocal images of fluorescence-negative wild-type and Tg(epd:EGFP-NTR; lyve1b:DsRed) embryonic/larval brains at 55 hpf (a) and 5 dpf (b). n = 30 embryos/larvae per panel. Scale bars: 200 µm. c, d Representative plots for fluorescence-activated cell (FAC) sorted EGFP-NTR-positive cells in brains of fluorescence-negative wild-type and Tg(epd:EGFP-NTR; lyve1b:DsRed) at 55 hpf (c) and 5 dpf (d). e Heatmap for differential expression levels of epd-positive cells and other selected known meningeal cell marker genes between whole fish (n = 100 fish per replicate) and FAC sorted epd-positive cells (EGFP-NTR-positive, n = 100 cells per replicate). ImC immune cell, GAN glial and neural cells, BEC blood vessel endothelial cell, PC pericytes, LEC lymphatic endothelial cell, FB fibroblasts, epd+ cells epd-positive cells. Scale bar represents relative expression by log2(FPKM + 1), from 0 (lowest) to 15 (highest). f Heatmap for differential expression levels of neurotrophic, pro-angiogenic, and pro-lymphangiogenic factors between whole fish (n = 100 fish per replicate) and FAC sorted epd-positive cells (EGFP-NTR-positive, n = 100 cells per replicate). Scale bar represents relative expression by log2(FPKM + 1), from 0 (lowest) to 7.55 (highest). |