
- Title
-
Neutrophil immune profile guides spinal cord regeneration in zebrafish
- Authors
- de Sena-Tomás, C., Rebola Lameira, L., Rebocho da Costa, M., Naique Taborda, P., Laborde, A., Orger, M., de Oliveira, S., Saúde, L.
- Source
- Full text @ Brain Behav. Immun.
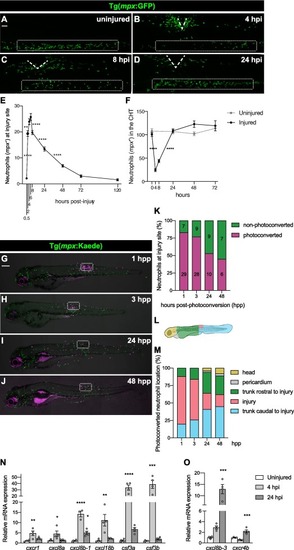
Neutrophils recruited to the injured spinal cord through conserved signaling pathways reverse migrate. (A − D) Representative lateral images of 3 dpf uninjured and injured larvae highlighting the recruitment, accumulation and gradual departure of neutrophils (mpx+). Bellow the injury site, the caudal hematopoietic tissue (CHT) initially empties and the replenishes, mirroring the neutrophil movements in the spinal cord. The injury site is marked with dashed lines and the CHT is outlined in the rectangular boxes. Scale bar, 50 μm. (E) Quantification reveal the number of mpx+ cells at the injury site, peaking at 4 – 6 h post-injury (hpi). Each square represents mean ± SEM (n = 20–31 performed as two independent experiments). One-way ANOVA followed by Tukey’s multiple comparisons test shows a significant difference between 0.5 and 2 (p < 0.0001), 2 and 4 (p = 0.0061), 6 and 8 (p < 0.0001), 8 and 24 (p < 0.0001), and 24 and 48 hpi (p < 0.0001) with no significant difference between 4 and 6 (p = 0.8642), 48 and 72 (p = 0.0885), and 72 and 120 hpi (p = 0.9895). (F) Quantification of mpx+ cells at the CHT demonstrated a sharp decrease between 0 and 4 hpi followed by recovery at 24 hpi. Each square represents mean ± SEM (n = 15–23 performed as two independent experiments). One-way ANOVA followed by Tukey’s multiple comparison test shows a significant difference between 0 and 4 (p < 0.0001) and 8 and 24 hpi (p < 0.0001) with no significant difference between 4 and 8 (p = 0.2610), 24 and 48 (p = 0.5644), 48 and 72 hpi (p > 0.9999), 0 hpi and 0 h uninjured (hu) (p = 0.9929), 24 hpi and 24 hu (p > 0.9999), 48 hpi and 48 hu (p = 0.1294), and 72 hpi and 72 hu (p = 0.9996). (G – J) Representative maximal projections of injured 3 dpf larvae with neutrophils (magenta) photoconverted at the injury site at 4 hpi and then tracked live at 1, 3, 24 and 48 h post-photoconversion (hpp). The injury site is outlined in rectangular boxes. Scale bar, 200 μm. (K) Quantification demonstrates the change in the ratio of photoconverted and non-photoconverted neutrophils at the injury site at 1, 3, 24 and 48 hpp (n = 13–15, performed as three independent experiments). Mean neutrophil numbers are displayed within the graph. (L) Scheme illustrating the different areas quantified to analyze the migratory pattern of the photoconverted neutrophils after spinal cord injury. (M) Quantification reveals the location of the photoconverted neutrophils at 1, 3, 24 and 48 hpp (n = 13–15, performed as three independent experiments). (N) Relative gene expression, as measured by qPCR, shows the upregulation of chemokines involved in guiding neutrophil forward migration. Each dot represents a biological replicate obtained from a pool of thirty trunks and each bar depicts the mean ± SEM. One-way ANOVA followed by Dunnet’s multiple comparisons test reveals significant differences between uninjured and 4 hpi samples for cxcr1 (p = 0.0065), cxcl8a (p = 0.0379), cxcl8b-1 (p < 0.0001), cxcl18b (p = 0.0038), csf3a (p < 0.0001) and csf3b (p = 0.0005), and between uninjured and 24 hpi for cxcl8b-1 (p = 0.015). (O) Relative gene expression, as measured by qPCR, indicates changes in signaling molecules involved in neutrophil inflammation resolution. Each dot represents a biological replicate, and each bar depicts the mean ± SEM. One-way ANOVA followed by Dunnet’s multiple comparisons test shows significant differences between uninjured and 24 hpi samples for cxcl8b-3 (p = 0.0005) and cxcr4b (p = 0.0008). |
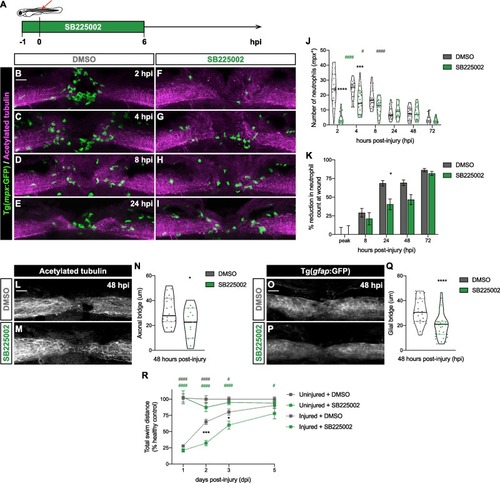
SB225002 treatment delays and attenuates neutrophil recruitment to the injured spinal cord impairing regeneration. (A) Scheme depicts the administration of SB225002 in 3 dpf zebrafish larvae, starting one hour before SCI and continuing for the first 6 h post-injury. (B-I) Representative maximal projections reveal neutrophils (green) recruited to the spinal cord (magenta) at 2, 4 and 8 hpi. Scale bar, 30 μm. (J) Quantification displays the number of neutrophils at the injured spinal cord, showing a significant delay and reduction in recruitment in SB225002-treated larvae (n = 18–22, performed as three independent experiments). Two-way ANOVA followed by Tukey’s multiple comparisons test indicates a significant difference between SB225002- and DMSO-treated larvae (asterisks) at 2 (p < 0.0001) and 4 hpi (p = 0.0004) with no significant difference at 8 (p = 0.0865), 24 (p > 0.9999), 48 (p > 0.9990) and 72 hpi (p > 0.9999). Statistically significant differences are also observed within each treatment for DMSO-treated larvae (grey pounds) between 4 and 8 hpi (p = 0.0456), and 8 and 24 hpi (p < 0.0001) and for SB225002-treated larvae (green pounds) between 2 and 4 hpi (p < 0.0001). (K) Quantification shows the percentage of reduction in neutrophil counts at the wound. Two-way ANOVA followed by Sidak’s multiple comparison test indicates a significant idecrease between SB225002- and DMSO-treated larvae at 24 hpi (p = and no significant difference at the peak (p > 0.9999), 8 (p = 0.9268), 48 (p = 0.0845) and 72 hpi (p = 0.9952). (L-M) Representative maximal projections of the spinal cord illustrate the axonal bridge. Scale bar, 30 μm. (N) Quantification of the axonal bridge thickness shows a significant decrease in SB225002-treated injured larvae, analyzed via an unpaired two-tailed t-test (p = 0.0349) (n = 15–18, performed as three independent experiments). (O-P) Representative maximal projections of the spinal cord show the glial bridge. Scale bar, 30 μm. (Q) Quantification reveals a significant decrease in the glial bridge in SB225002-treated injured larvae, analyzed through an unpaired two-tailed t-test (p < 0.0001) (n = 28–32, performed as two independent experiments). (R) Recovery of the swimming capacity expressed as the total swim distance in relationship to the healthy control (n = 29–61, performed as three independent experiments). Two-way ANOVA followed by Tukey’s multiple comparison displays significant difference between injured SB225002- and DMSO-treated larvae (asterisks) at 2 (p = 0.0004) and 3 dpi (p = 0.0449); between injured and uninjured DMSO-treated larvae (grey pound) at 1 (p < 0.0001), 2 (p < 0.0001) and 3 dpi (p = 0.0138); and between injured SB225002- and uninjured DMSO-treated larvae (green pound) at 1 (p < 0.0001), 2 (p < 0.0001), 3 (p < 0.0001) and 5 dpi (p = 0.0278). |
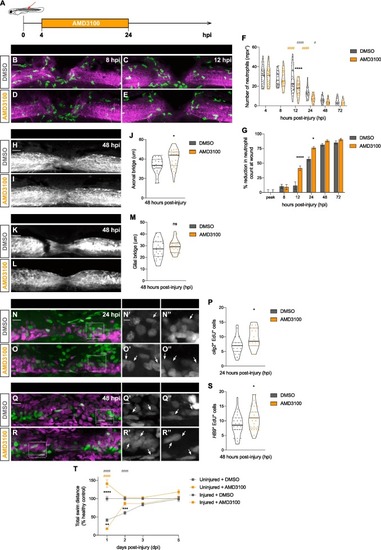
AMD3100 fastens neutrophil clearance from the injured spinal cord and improves spinal cord regeneration. (A) Scheme represents the administration of AMD3100 3 dpf larvae, from 4 until 24 hpi. (B − E) Representative maximal projections display neutrophils (green) recruited to the injured spinal cord (magenta) at 8 and 12 hpi. Scale bar, 30 μm. (F) Quantification of neutrophil numbers at the injury site at 4, 8, 12, 24, 48 and 72 hpi (n = 40 (4, 8 and 12 hpi), 31 (24 hpi), 24 (48 hpi) and 19 (72 hpi), from three independent experiments). Two-way ANOVA followed by Tukey’s multiple comparisons test indicates a significant decrease between AMD3100- and DMSO-treated larvae at 12 hpi (p < 0.0001) (black asterisk) with no significant difference at any other timepoints. Significant differences were also observed within each treatment for DMSO-treated larvae (grey pounds) between 12 and 24 hpi (p < 0.0001) and 24 and 48 hpi (p = 0.0121), and AMD3100-treated larvae (orange pounds) between 8 and 12 hpi (p < 0.0001) and 12 and 24 hpi (p < 0.0001). (G) Quantification shows the percentage of reduction in neutrophil counts at the wound. Two-way ANOVA followed by Sidak’s multiple comparison test indicates a significant increase between AMD3100- and DMSO-treated larvae at 12 (p < 0.0001) and 24 hpi (p = 0.0134) and no significant difference at the peak and 8 hpi (p > 0.9999), 48 (p = 0.9282) and 72 hpi (p = 0.9870). (H, I) Representative maximal projections of the spinal cord, highlighting the axonal bridge. Scale bar, 30 μm. (J) Quantification of the axonal bridge thickness reveals a significant increase between AMD3100- and DMSO-treated injured larvae, analyzed via an unpaired two-tailed t-test (p = 0.0105) (n = 21–24, from two independent experiments). (K, L) Representative maximal projections showing the glial bridge. Scale bar, 30 μm. (M) Quantification of the glial bridge demonstrates no significant difference between AMD3100- and DMSO-treated larvae, analyzed using an unpaired two-tailed t-test (p = 0.2675) (n = 24–30, from two independent experiments). (N, O) Representative maximal projections of the spinal cord illustrate EdU incorporation in neural progenitors (olig2+ cells). Scale bar, 30 μm. Higher magnification panels (N’,O’) and (N’’, O’’) indicate regions outlined in rectangular boxes for the Edu and olig2 channels, respectively. Scale bar, 10 μm. (P) Quantification of Edu+ olig2+ cells in DMSO- and AMD3100- treated larvae (n = 19–20, from three independent experiments) shows a significant difference (p = 0.0213) via an unpaired two-tailed t-test. (Q, R) Representative maximal projections of the spinal cord exhibit EdU incorporation in motoneurons (HB9+ cells). Scale bar, 30 μm. Higher magnification panels (Q’, R’) and (Q’’,’R’) indicate regions outlined in rectangular boxes for the Edu and HB9 channels, respectively. Scale bar, 10 μm. (S) Quantification of Edu+ HB9+ cells in DMSO- and AMD3100- treated larvae (n = 19–20, from three independent experiments) shows a significant difference (p = 0.0428) via an unpaired two-tailed t-test. (T) Recovery of the swimming capacity, expressed as the total swim distance in relationship to the uninjured control (n = 40–71, from three independent experiments). Two-way ANOVA followed by Tukey’s multiple comparison test reveals significant difference between injured AMD3100- and DMSO-treated larvae (black asterisks) at 1 (p = 0.0099) and 2 dpi (p = 0.0002), between uninjured AMD3100- and DMSO-treated larvae (black asterisk) at 1 dpi (p < 0.0001), between injured and uninjured DMSO-treated larvae (grey pounds) at 1 (p < 0.0001) and 2 dpi (p < 0.0001); and between injured AMD3100- and uninjured DMSO-treated larvae (orange pounds) at 1 dpi (p < 0.0001). |
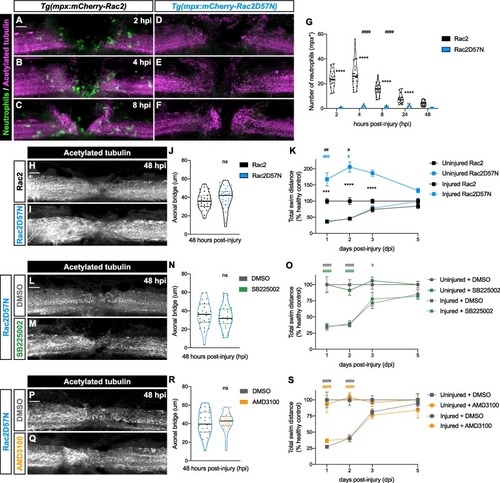
Normal regeneration in Rac2D25N zebrafish larvae following SB225002 or AMD3100 treatment. (A − F) Representative maximal projections depict the injury site at 2, 4 and 8 hpi. Tg(mpx:mCherry-Rac2) larvae (A – C) show a normal recruitment of neutrophils (green) to the spinal cord (magenta), while no neutrophils were observed in the injured spinal cord of Tg(mpx:mCherry-Rac2D57N) larvae (D – F). Scale bar, 30 μm. (G) Quantification of mpx+ cells at the injury site demonstrates that neutrophils peak at 2 – 4 hpi in Tg(mpx:mCherry-Rac2) larvae. Individual values per larvae are shown (n = 18–22 performed in two independent experiments). Two-way ANOVA followed by Tukey’s multiple comparisons test reveals statistically significant differences between 4 and 8 hpi (p < 0.0001) and 8 and 24 hpi (p < 0.0001) in wild-type Rac2 transgenic line. Furthermore, significant differences between wild-type Rac2 and mutant Rac2D57N transgenic lines at 2 (p < 0.0001), 4 (p < 0.0001), 8 (p < 0.0001) and 24 hpi (p < 0.0001) were detected. (H, I) Illustrative maximal projections of the spinal cord, highlighting the axonal bridge. Scale bar, 30 μm. (J) Quantitative analysis of the axonal bridge thickness indicates no statistically significant difference between wild-type Rac2 and mutant Rac2D57N transgenic larvae, analyzed via unpaired two-tailed t-test (p = 0.3393) (n = 31–32, conducted in three independent experiments). (K) Recovery of the swimming capacity expressed as the total swim distance (n = 29–60, performed in two independent experiments). Two-way ANOVA followed by Tukey’s multiple comparison test reveals no statistically significant difference between injured Rac2D57N and Rac2 larvae at 1, 2, 3 and 5 dpi (p > 0.9999). Statistically significant differences are found between uninjured Rac2D57N and Rac2 larvae (asterisks) at 1 (p = 0.0001), 2 (p < 0.0001) and 3 dpi (p < 0.0001), between injured Rac2D57N and uninjured Rac2 larvae (blue pounds) at 1(p = 0.0009) and 2 dpi (p = 0.0499), and between injured and uninjured Rac2 larvae (black pounds) at 1 dpi (p = 0.0013) and 2 dpi (p = 0.0354). (L, M) Representative maximal projections of Rac2D57N injured spinal cord, treated with DMSO or SB225002, illustrate the axonal bridge. Scale bar, 30 μm. (N) Quantification of the axonal bridge thickness reveals no statistically significant difference between SB225002- and DMSO-treated Rac2D57N larvae, analyzed via unpaired two tailed t-test (p = 0.4344) (n = 26–28, performed in three independent experiments). (O) Recovery of the swimming capacity expressed as the total swim distance (n = 27–40, performed in two independent experiments). Two-way ANOVA followed by Tukey’s multiple comparison test demonstrates no statistically significant difference between injured SB225002- and DMSO-treated Rac2D57N larvae at 1 (p = 0.9991), 2 (p = 0.9958), 3 (p = 0.9368) and 5 dpi (p = 0.9930). Statistically significant differences are observed between injured and uninjured DMSO-treated larvae (grey pounds) at 1 (p < 0.0001), 2 (p < 0.0001) and 3 dpi (p = 0.0362), as well as between injured SB225002- and uninjured DMSO-treated larvae (green pounds) at 1 (p < 0.0001) and 2 dpi (p < 0.0001). (P, Q) Representative maximal projections of Rac2D57N injured spinal cord, treated with DMSO or AMD3100, display the axonal bridge. Scale bar, 30 μm. (R) Quantification of the axonal bridge shows no statistically significant difference between AMD3100- and DMSO-treated Rac2D57N larvae, analyzed via unpaired two-tailed t-test (p = 0.8312) (n = 22–26, performed in two independent experiments). (S) Recovery of the swimming capacity expressed as the total swim distance (n = 24–39, performed in three independent experiments). Two-way ANOVA followed by Tukey’s multiple comparison test reveals no statistically significant difference between injured AMD3100- and DMSO-treated larvae at 1 (p = 0.7483), 2 (p > 0.9999), 3 (p = 0.9473) and 5 dpi (p = 0.7990). Statistically significant differences are found between injured and uninjured DMSO-treated larvae (grey pounds) at 1 (p < 0.0001) and 2 dpi (p < 0.0001), as well as between injured AMD3100- and uninjured DMSO-treated larvae (orange pounds) at 1 dpi (p < 0.0001) and 2 dpi (p < 0.0001). |
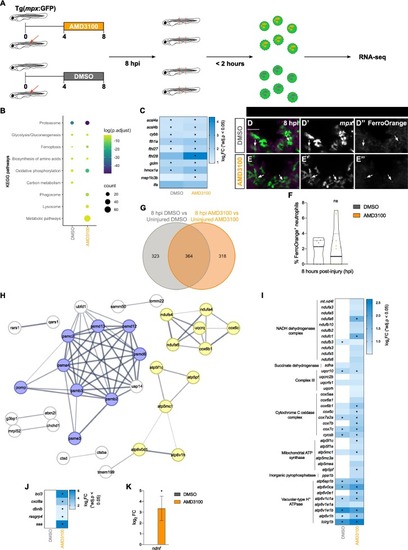
Injury responsive neutrophils exhibit an enhanced activation state upon AMD3100 treatment. (A) Scheme illustrating the experimental design. (B) KEGG pathways analysis of DEGs (p.adjust < 0.05) in the 8 hpi DMSO vs uninjured DMSO (DMSO) and in the 8 hpi AMD3100 vs uninjured AMD3100 (AMD3100) comparisons. Circle color and size correspond to the log (p. adjust) value and the number of genes, respectively. (C) Heatmap analysis of DEGs related to ferroptosis in the DMSO and AMD3100 comparisons. Log2 fold change is displayed as blue color gradient when genes present a p value < 0.05. Stars indicate statistical significance (p.adjust < 0.05). (D, E) Representative maximal projection illustrating FerroOrange + neutrophils in the injured spinal cord at 8 hpi in DMSO and AMD3100-treated larvae. Scale bar, 30 μm. Individual panels for mpx (D’, E’) and FerroOrange staining (D’’, E’’). (F) Quantification of the percentage of neutrophils positive for FerroOrange at 8 hpi in DMSO and AMD3100-treated larvae (n = 9–10, performed as two independent experiments). Unpaired two-tailed t-test shows no statistically significant difference between DMSO and AMD3100- treated larvae (p = 0.6534). (G) Venn diagram depicting DEGs (p adjust < 0.05) in 8 hpi DMSO compared to uninjured DMSO and in 8 hpi AMD3100 compared to uninjured AMD3100. (H) Network analysis of AMD3100-specific DEGs related to proteasome (blue) and oxidative phosphorylation (yellow). Protein-protein interaction enrichment p = 8.83e-13. (I) Heatmap analysis of DEGs related to oxidative phosphorylation in the 8 hpi DMSO vs uninjured DMSO (DMSO) and 8 hpi AMD3100 vs uninjured AMD3100 (AMD3100) comparisons. Log2 fold change is displayed as blue color gradient when genes present a p value < 0.05. Stars indicate statistical significance (p.adjust < 0.05). (J) Heatmap analysis depicting DEGs related to activated neutrophils in the 8 hpi DMSO vs uninjured DMSO (DMSO) and 8 hpi AMD3100 vs uninjured AMD3100 (AMD3100) comparisons. Log2 fold change is displayed as blue color gradient, and stars indicate statistical significance (p.adjust < 0.05). (K) Bar graph illustrating the upregulated expression of neuron-derived neurotrophic factor in the AMD3100 (8 hpi vs. uninjured) comparison. |
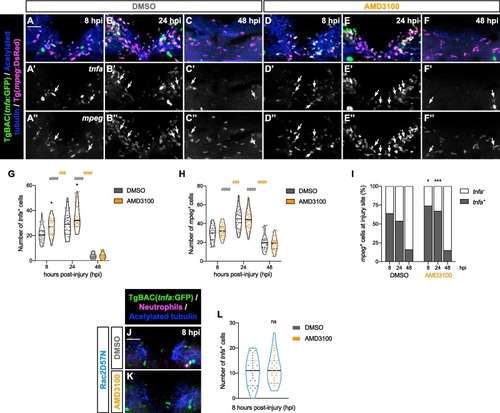
Enhanced proportion of mpeg+ tnfa+ cells following AMD3100 treatment. (A – F) Representative maximal projections display mpeg+ cells and tnfa+ cells in the injured spinal cord at 8, 24 and 48 hpi in DMSO and AMD3100-treated larvae. Scale bar, 30 μm. Individual panels for tnfa (A’ – F’) and mpeg (A’’ − F’’) where double-positive cells are indicated by arrows. (G) Quantification of the number of tnfa+ cells in the injured spinal cord at 8, 24 and 48 hpi in DMSO and AMD3100-treated larvae (n = 26–33, conducted in three independent experiments). Two-way ANOVA followed by Tukey’s multiple comparison test reveals a statistically significant difference between AMD3100- and DMSO-treated larvae (asterisk) at 8 hpi (p = 0.0181) and 24 hpi (p = 0.0132), with no statistically significant difference at 48 hpi (p > 0.9999). Additionally, within the DMSO-treated larvae (grey pounds), significant differences were observed between 8 and 24 hpi (p < 0.0001) and 24 and 48 hpi (p < 0.0001). Within the AMD3100-treated group (orange pounds), differences were observed between 8 and 24 hpi (p = 0.0003) and 24 and 48 hpi (p > 0.0001). (H) Quantification of mpeg+ cell number in the injured spinal cord at 8, 24 and 48 hpi in DMSO- and AMD3100-treated larvae (n = 26–33, performed in three independent experiments). Two-way ANOVA followed by Tukey’s multiple comparison test exhibits statistically significant difference between 8 and 24 hpi and 24 and 48 hpi (p < 0.0001 for both DMSO and AMD3100-treated larvae in both timepoint comparisons). (I) Quantification of the percentage of mpeg+ tnfa+ cells in the injured spinal cord at 8, 24 and 48 hpi in DMSO and AMD3100-treated larvae (n = 26–33, conducted in three independent experiments). Two-way ANOVA followed by Sidak’s multiple comparisons test shows a statistically significant increase between AMD3100 and DMSO-treated larvae at 8 hpi (p = 0.0283) and 24 hpi (p = 0.0005), with no statistically significant difference at 48 hpi (p = 0.9250). (J, K) Representative maximal projections illustrate tnfa+ cells in the injured spinal cord of Rac2D57N larvae, treated with DMSO or AMD3100, at 8 hpi. Scale bar, 30 μm. (L) Quantification of the number of tnfa+ cells in the injured spinal cord at 8 hpi in DMSO and AMD3100-Rac2D57N larvae (n = 27, conducted in two independent experiments). Unpaired two-tailed t-test shows no statistically significant difference between DMSO and AMD3100-treated larvae at 8 hpi (p = 0.5767). |
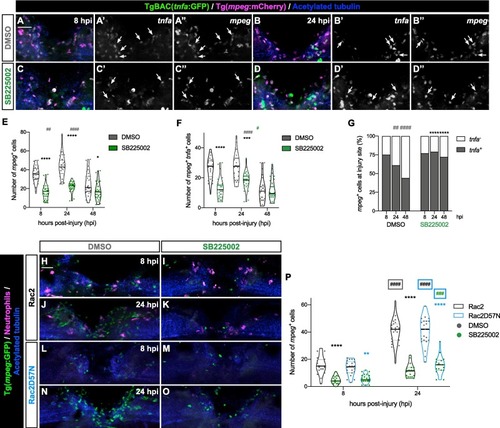
SB225002-treated neutrophils attenuate mpeg+ presence at the injury site. (A – D) Representative maximal projections displaying mpeg+ and tnfa+ cells in the injured spinal cord at 8 and 24 hpi in DMSO- and SB225002-treated larvae. Scale bar, 30 μm. Individual panels for tnfa (A’ − D’) and mpeg (A’’ − D’’) highlight double-positive cells. (E) Quantification of mpeg+ cells in the injured spinal cord (n = 24–31, performed as two independent experiments). Two-way ANOVA followed by Tukey’s multiple comparison test revealed a statistically significant difference between DMSO- and SB225002-treated larvae at 8 (p < 0.0001), 24 (p < 0.0001) and 48 hpi (p = 0.0315). Additionally, significant differences were observed in DMSO-treated larvae between 8 and 24 hpi (p = 0.0079) and between 24 and 48 hpi (p < 0.0001) (grey pounds), with no significant difference in SB225002-treated larvae between 8 and 24 hpi (p = 0.2161) and 24 and 48 hpi (p = 0.3950). (F) Quantification of the number of mpeg+ tnfa+ cells in the injured spinal cord (n = 24–31, performed as two independent experiments). Two-way ANOVA followed by Tukey’s multiple comparison test showed a statistically significant decrease between DMSO- and SB225002-treated larvae at 8 (p < 0.0001) and 24 hpi (p = 0.002), with no significant difference at 48 hpi (p = 0.9991). (G) Quantification of the proportion of mpeg+ tnfa+ cells over the total mpeg+ population (n = 24–31, performed as two independent experiments). Two-way ANOVA followed by Tukey’s multiple comparison test showing statistically significant increase between DMSO- and SB225002-treated larvae at 24 (p < 0.0001) and 48 hpi (p < 0.0001). Additionally, a significant decrease was observed in the DMSO-treated group between 8 and 24 hpi (p = 0.0014) and 24 and 48 hpi (p < 0.0001). (H – O) Representative maximal projections illustrate mpeg+ cells in transgenic Rac2 and Rac2D57N DMSO- and SB225002-treated larvae at 8 and 24 hpi. Scale bar, 30 μm. (P) Quantification of mpeg+ cells in the injured spinal cord in Rac2 and Rac2D57N larvae (n = 18–23, performed as two independent experiments). Two-way ANOVA followed by Tukey’s multiple comparison test showed a significant decrease between DMSO- and SB225002-treated larvae at 8 (p < 0.0001) and 24 hpi (p < 0.0001) in Rac2 larvae and at 8 (p = 0.0039) and 24 hpi (p < 0.0001) in Rac2D57N larvae. Additionally, significant increases were observed between 8 and 24 hpi in DMSO- Rac2 (p < 0.0001) and Rac2D57N (p < 0.0001) and SB225002- Rac2D57N treated larvae (p = 0.0002). No statistically significant difference in SB225002 Rac2 larvae between 8 and 24 hpi was observed (p = 0.0707). |
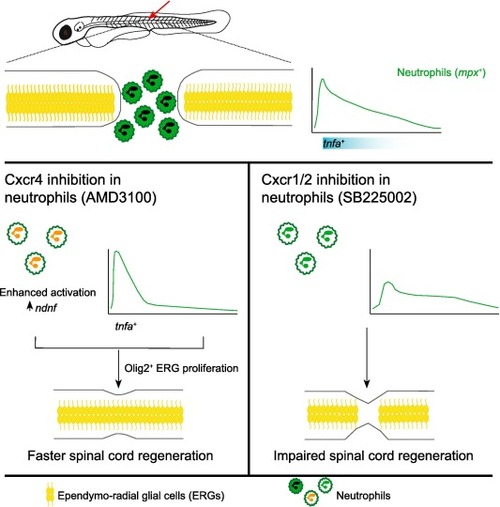
Neutrophil immune profile controls spinal cord regeneration. Spinal cord injury induces a quick infiltration of neutrophils to the injury site. Conserved chemokine pathways control neutrophil infiltration dynamics. Inhibition of Cxcr4 induces early resolution of neutrophil inflammation, enhancing their activation state and production of the neural growth factor ndnf at the transcriptional level. These changes translate into transient increased expression of tnf-α in macrophage/microglia and promotion of axonal regrowth. Conversely, Cxcr1/2 inhibition besides delaying and attenuating neutrophil recruitment, induces a detrimental inflammatory profile in neutrophils, decreasing the accumulation of macrophage/microglia at the injury site and impairing axonal regrowth. |