
Fig. 6
- ID
- ZDB-FIG-240725-6
- Publication
- de Sena-Tomás et al., 2024 - Neutrophil immune profile guides spinal cord regeneration in zebrafish
- Other Figures
- All Figure Page
- Back to All Figure Page
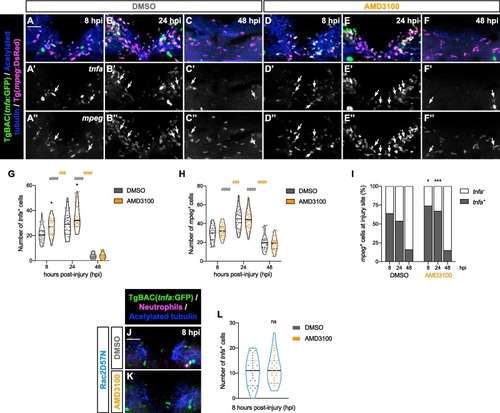
Enhanced proportion of mpeg+ tnfa+ cells following AMD3100 treatment. (A – F) Representative maximal projections display mpeg+ cells and tnfa+ cells in the injured spinal cord at 8, 24 and 48 hpi in DMSO and AMD3100-treated larvae. Scale bar, 30 μm. Individual panels for tnfa (A’ – F’) and mpeg (A’’ − F’’) where double-positive cells are indicated by arrows. (G) Quantification of the number of tnfa+ cells in the injured spinal cord at 8, 24 and 48 hpi in DMSO and AMD3100-treated larvae (n = 26–33, conducted in three independent experiments). Two-way ANOVA followed by Tukey’s multiple comparison test reveals a statistically significant difference between AMD3100- and DMSO-treated larvae (asterisk) at 8 hpi (p = 0.0181) and 24 hpi (p = 0.0132), with no statistically significant difference at 48 hpi (p > 0.9999). Additionally, within the DMSO-treated larvae (grey pounds), significant differences were observed between 8 and 24 hpi (p < 0.0001) and 24 and 48 hpi (p < 0.0001). Within the AMD3100-treated group (orange pounds), differences were observed between 8 and 24 hpi (p = 0.0003) and 24 and 48 hpi (p > 0.0001). (H) Quantification of mpeg+ cell number in the injured spinal cord at 8, 24 and 48 hpi in DMSO- and AMD3100-treated larvae (n = 26–33, performed in three independent experiments). Two-way ANOVA followed by Tukey’s multiple comparison test exhibits statistically significant difference between 8 and 24 hpi and 24 and 48 hpi (p < 0.0001 for both DMSO and AMD3100-treated larvae in both timepoint comparisons). (I) Quantification of the percentage of mpeg+ tnfa+ cells in the injured spinal cord at 8, 24 and 48 hpi in DMSO and AMD3100-treated larvae (n = 26–33, conducted in three independent experiments). Two-way ANOVA followed by Sidak’s multiple comparisons test shows a statistically significant increase between AMD3100 and DMSO-treated larvae at 8 hpi (p = 0.0283) and 24 hpi (p = 0.0005), with no statistically significant difference at 48 hpi (p = 0.9250). (J, K) Representative maximal projections illustrate tnfa+ cells in the injured spinal cord of Rac2D57N larvae, treated with DMSO or AMD3100, at 8 hpi. Scale bar, 30 μm. (L) Quantification of the number of tnfa+ cells in the injured spinal cord at 8 hpi in DMSO and AMD3100-Rac2D57N larvae (n = 27, conducted in two independent experiments). Unpaired two-tailed t-test shows no statistically significant difference between DMSO and AMD3100-treated larvae at 8 hpi (p = 0.5767). |