
|
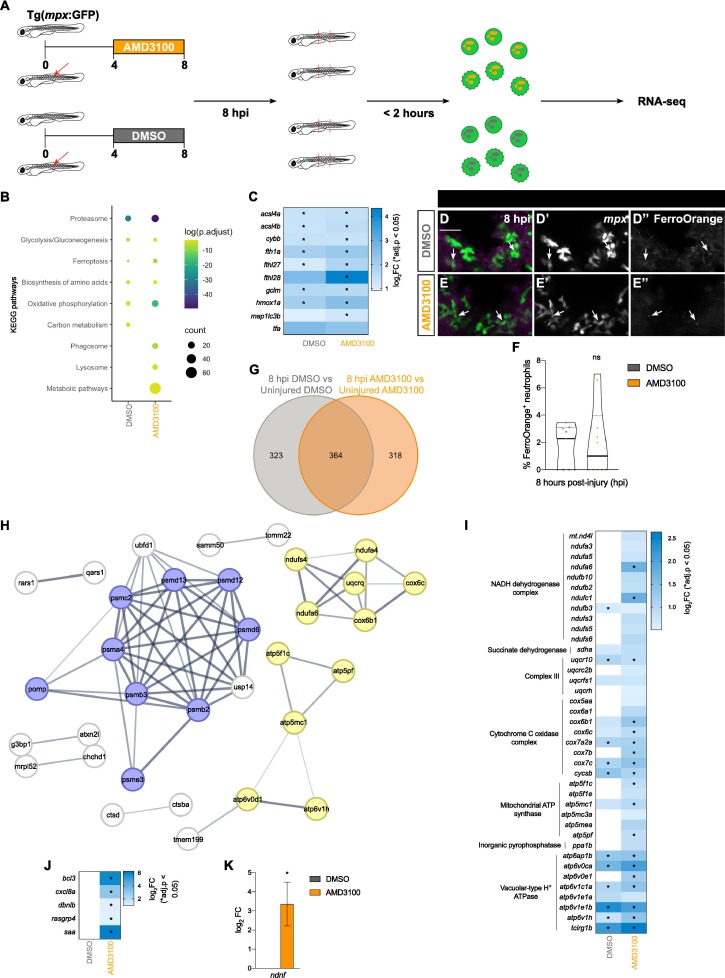
Fig. 5 Injury responsive neutrophils exhibit an enhanced activation state upon AMD3100 treatment. (A) Scheme illustrating the experimental design. (B) KEGG pathways analysis of DEGs (p.adjust < 0.05) in the 8 hpi DMSO vs uninjured DMSO (DMSO) and in the 8 hpi AMD3100 vs uninjured AMD3100 (AMD3100) comparisons. Circle color and size correspond to the log (p. adjust) value and the number of genes, respectively. (C) Heatmap analysis of DEGs related to ferroptosis in the DMSO and AMD3100 comparisons. Log2 fold change is displayed as blue color gradient when genes present a p value < 0.05. Stars indicate statistical significance (p.adjust < 0.05). (D, E) Representative maximal projection illustrating FerroOrange + neutrophils in the injured spinal cord at 8 hpi in DMSO and AMD3100-treated larvae. Scale bar, 30 μm. Individual panels for mpx (D’, E’) and FerroOrange staining (D’’, E’’). (F) Quantification of the percentage of neutrophils positive for FerroOrange at 8 hpi in DMSO and AMD3100-treated larvae (n = 9–10, performed as two independent experiments). Unpaired two-tailed t-test shows no statistically significant difference between DMSO and AMD3100- treated larvae (p = 0.6534). (G) Venn diagram depicting DEGs (p adjust < 0.05) in 8 hpi DMSO compared to uninjured DMSO and in 8 hpi AMD3100 compared to uninjured AMD3100. (H) Network analysis of AMD3100-specific DEGs related to proteasome (blue) and oxidative phosphorylation (yellow). Protein-protein interaction enrichment p = 8.83e-13. (I) Heatmap analysis of DEGs related to oxidative phosphorylation in the 8 hpi DMSO vs uninjured DMSO (DMSO) and 8 hpi AMD3100 vs uninjured AMD3100 (AMD3100) comparisons. Log2 fold change is displayed as blue color gradient when genes present a p value < 0.05. Stars indicate statistical significance (p.adjust < 0.05). (J) Heatmap analysis depicting DEGs related to activated neutrophils in the 8 hpi DMSO vs uninjured DMSO (DMSO) and 8 hpi AMD3100 vs uninjured AMD3100 (AMD3100) comparisons. Log2 fold change is displayed as blue color gradient, and stars indicate statistical significance (p.adjust < 0.05). (K) Bar graph illustrating the upregulated expression of neuron-derived neurotrophic factor in the AMD3100 (8 hpi vs. uninjured) comparison.