
Fig. 2
- ID
- ZDB-FIG-240725-2
- Publication
- de Sena-Tomás et al., 2024 - Neutrophil immune profile guides spinal cord regeneration in zebrafish
- Other Figures
- All Figure Page
- Back to All Figure Page
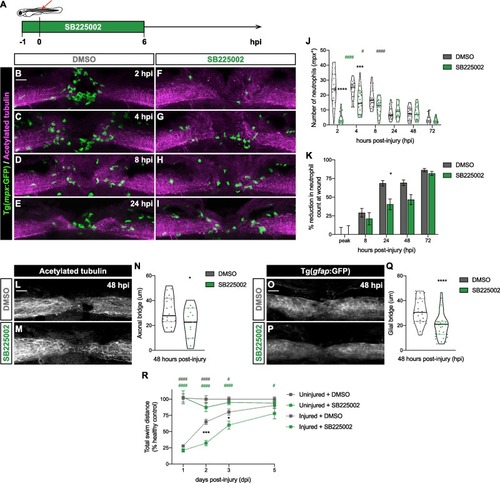
SB225002 treatment delays and attenuates neutrophil recruitment to the injured spinal cord impairing regeneration. (A) Scheme depicts the administration of SB225002 in 3 dpf zebrafish larvae, starting one hour before SCI and continuing for the first 6 h post-injury. (B-I) Representative maximal projections reveal neutrophils (green) recruited to the spinal cord (magenta) at 2, 4 and 8 hpi. Scale bar, 30 μm. (J) Quantification displays the number of neutrophils at the injured spinal cord, showing a significant delay and reduction in recruitment in SB225002-treated larvae (n = 18–22, performed as three independent experiments). Two-way ANOVA followed by Tukey’s multiple comparisons test indicates a significant difference between SB225002- and DMSO-treated larvae (asterisks) at 2 (p < 0.0001) and 4 hpi (p = 0.0004) with no significant difference at 8 (p = 0.0865), 24 (p > 0.9999), 48 (p > 0.9990) and 72 hpi (p > 0.9999). Statistically significant differences are also observed within each treatment for DMSO-treated larvae (grey pounds) between 4 and 8 hpi (p = 0.0456), and 8 and 24 hpi (p < 0.0001) and for SB225002-treated larvae (green pounds) between 2 and 4 hpi (p < 0.0001). (K) Quantification shows the percentage of reduction in neutrophil counts at the wound. Two-way ANOVA followed by Sidak’s multiple comparison test indicates a significant idecrease between SB225002- and DMSO-treated larvae at 24 hpi (p = and no significant difference at the peak (p > 0.9999), 8 (p = 0.9268), 48 (p = 0.0845) and 72 hpi (p = 0.9952). (L-M) Representative maximal projections of the spinal cord illustrate the axonal bridge. Scale bar, 30 μm. (N) Quantification of the axonal bridge thickness shows a significant decrease in SB225002-treated injured larvae, analyzed via an unpaired two-tailed t-test (p = 0.0349) (n = 15–18, performed as three independent experiments). (O-P) Representative maximal projections of the spinal cord show the glial bridge. Scale bar, 30 μm. (Q) Quantification reveals a significant decrease in the glial bridge in SB225002-treated injured larvae, analyzed through an unpaired two-tailed t-test (p < 0.0001) (n = 28–32, performed as two independent experiments). (R) Recovery of the swimming capacity expressed as the total swim distance in relationship to the healthy control (n = 29–61, performed as three independent experiments). Two-way ANOVA followed by Tukey’s multiple comparison displays significant difference between injured SB225002- and DMSO-treated larvae (asterisks) at 2 (p = 0.0004) and 3 dpi (p = 0.0449); between injured and uninjured DMSO-treated larvae (grey pound) at 1 (p < 0.0001), 2 (p < 0.0001) and 3 dpi (p = 0.0138); and between injured SB225002- and uninjured DMSO-treated larvae (green pound) at 1 (p < 0.0001), 2 (p < 0.0001), 3 (p < 0.0001) and 5 dpi (p = 0.0278). |