
|
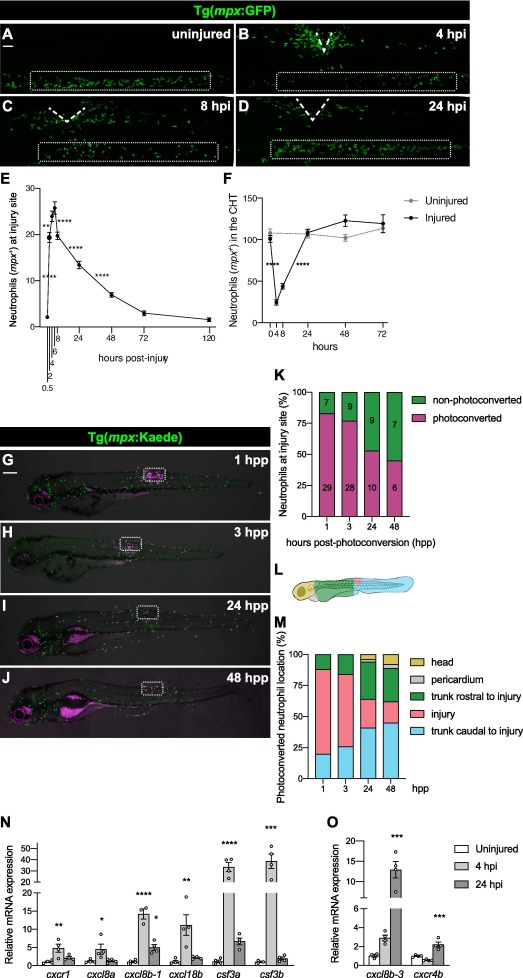
Fig. 1 Neutrophils recruited to the injured spinal cord through conserved signaling pathways reverse migrate. (A − D) Representative lateral images of 3 dpf uninjured and injured larvae highlighting the recruitment, accumulation and gradual departure of neutrophils (mpx+). Bellow the injury site, the caudal hematopoietic tissue (CHT) initially empties and the replenishes, mirroring the neutrophil movements in the spinal cord. The injury site is marked with dashed lines and the CHT is outlined in the rectangular boxes. Scale bar, 50 μm. (E) Quantification reveal the number of mpx+ cells at the injury site, peaking at 4 – 6 h post-injury (hpi). Each square represents mean ± SEM (n = 20–31 performed as two independent experiments). One-way ANOVA followed by Tukey’s multiple comparisons test shows a significant difference between 0.5 and 2 (p < 0.0001), 2 and 4 (p = 0.0061), 6 and 8 (p < 0.0001), 8 and 24 (p < 0.0001), and 24 and 48 hpi (p < 0.0001) with no significant difference between 4 and 6 (p = 0.8642), 48 and 72 (p = 0.0885), and 72 and 120 hpi (p = 0.9895). (F) Quantification of mpx+ cells at the CHT demonstrated a sharp decrease between 0 and 4 hpi followed by recovery at 24 hpi. Each square represents mean ± SEM (n = 15–23 performed as two independent experiments). One-way ANOVA followed by Tukey’s multiple comparison test shows a significant difference between 0 and 4 (p < 0.0001) and 8 and 24 hpi (p < 0.0001) with no significant difference between 4 and 8 (p = 0.2610), 24 and 48 (p = 0.5644), 48 and 72 hpi (p > 0.9999), 0 hpi and 0 h uninjured (hu) (p = 0.9929), 24 hpi and 24 hu (p > 0.9999), 48 hpi and 48 hu (p = 0.1294), and 72 hpi and 72 hu (p = 0.9996). (G – J) Representative maximal projections of injured 3 dpf larvae with neutrophils (magenta) photoconverted at the injury site at 4 hpi and then tracked live at 1, 3, 24 and 48 h post-photoconversion (hpp). The injury site is outlined in rectangular boxes. Scale bar, 200 μm. (K) Quantification demonstrates the change in the ratio of photoconverted and non-photoconverted neutrophils at the injury site at 1, 3, 24 and 48 hpp (n = 13–15, performed as three independent experiments). Mean neutrophil numbers are displayed within the graph. (L) Scheme illustrating the different areas quantified to analyze the migratory pattern of the photoconverted neutrophils after spinal cord injury. (M) Quantification reveals the location of the photoconverted neutrophils at 1, 3, 24 and 48 hpp (n = 13–15, performed as three independent experiments). (N) Relative gene expression, as measured by qPCR, shows the upregulation of chemokines involved in guiding neutrophil forward migration. Each dot represents a biological replicate obtained from a pool of thirty trunks and each bar depicts the mean ± SEM. One-way ANOVA followed by Dunnet’s multiple comparisons test reveals significant differences between uninjured and 4 hpi samples for cxcr1 (p = 0.0065), cxcl8a (p = 0.0379), cxcl8b-1 (p < 0.0001), cxcl18b (p = 0.0038), csf3a (p < 0.0001) and csf3b (p = 0.0005), and between uninjured and 24 hpi for cxcl8b-1 (p = 0.015). (O) Relative gene expression, as measured by qPCR, indicates changes in signaling molecules involved in neutrophil inflammation resolution. Each dot represents a biological replicate, and each bar depicts the mean ± SEM. One-way ANOVA followed by Dunnet’s multiple comparisons test shows significant differences between uninjured and 24 hpi samples for cxcl8b-3 (p = 0.0005) and cxcr4b (p = 0.0008).