
|
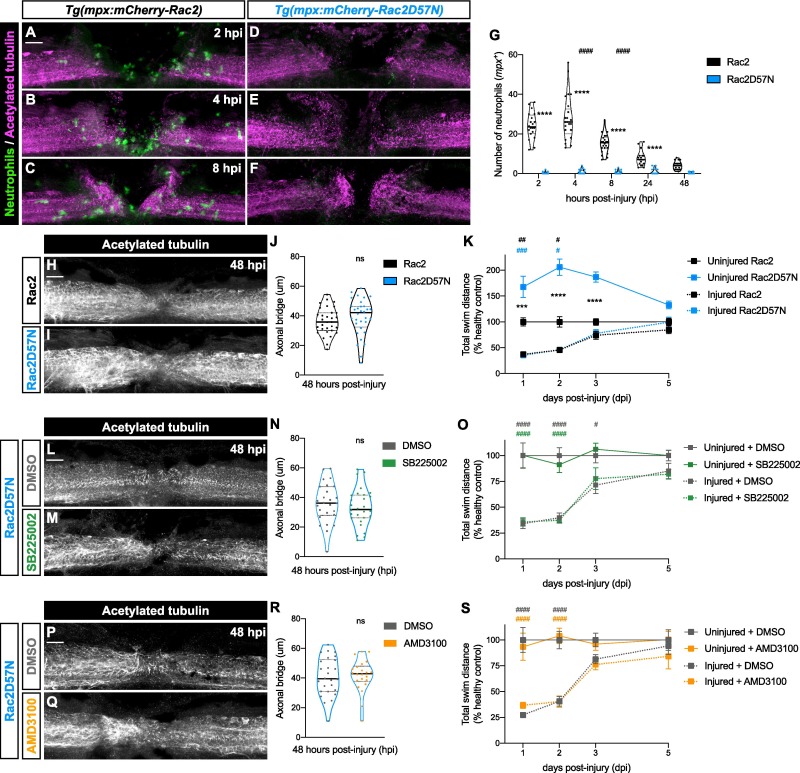
Fig. 4 Normal regeneration in Rac2D25N zebrafish larvae following SB225002 or AMD3100 treatment. (A − F) Representative maximal projections depict the injury site at 2, 4 and 8 hpi. Tg(mpx:mCherry-Rac2) larvae (A – C) show a normal recruitment of neutrophils (green) to the spinal cord (magenta), while no neutrophils were observed in the injured spinal cord of Tg(mpx:mCherry-Rac2D57N) larvae (D – F). Scale bar, 30 μm. (G) Quantification of mpx+ cells at the injury site demonstrates that neutrophils peak at 2 – 4 hpi in Tg(mpx:mCherry-Rac2) larvae. Individual values per larvae are shown (n = 18–22 performed in two independent experiments). Two-way ANOVA followed by Tukey’s multiple comparisons test reveals statistically significant differences between 4 and 8 hpi (p < 0.0001) and 8 and 24 hpi (p < 0.0001) in wild-type Rac2 transgenic line. Furthermore, significant differences between wild-type Rac2 and mutant Rac2D57N transgenic lines at 2 (p < 0.0001), 4 (p < 0.0001), 8 (p < 0.0001) and 24 hpi (p < 0.0001) were detected. (H, I) Illustrative maximal projections of the spinal cord, highlighting the axonal bridge. Scale bar, 30 μm. (J) Quantitative analysis of the axonal bridge thickness indicates no statistically significant difference between wild-type Rac2 and mutant Rac2D57N transgenic larvae, analyzed via unpaired two-tailed t-test (p = 0.3393) (n = 31–32, conducted in three independent experiments). (K) Recovery of the swimming capacity expressed as the total swim distance (n = 29–60, performed in two independent experiments). Two-way ANOVA followed by Tukey’s multiple comparison test reveals no statistically significant difference between injured Rac2D57N and Rac2 larvae at 1, 2, 3 and 5 dpi (p > 0.9999). Statistically significant differences are found between uninjured Rac2D57N and Rac2 larvae (asterisks) at 1 (p = 0.0001), 2 (p < 0.0001) and 3 dpi (p < 0.0001), between injured Rac2D57N and uninjured Rac2 larvae (blue pounds) at 1(p = 0.0009) and 2 dpi (p = 0.0499), and between injured and uninjured Rac2 larvae (black pounds) at 1 dpi (p = 0.0013) and 2 dpi (p = 0.0354). (L, M) Representative maximal projections of Rac2D57N injured spinal cord, treated with DMSO or SB225002, illustrate the axonal bridge. Scale bar, 30 μm. (N) Quantification of the axonal bridge thickness reveals no statistically significant difference between SB225002- and DMSO-treated Rac2D57N larvae, analyzed via unpaired two tailed t-test (p = 0.4344) (n = 26–28, performed in three independent experiments). (O) Recovery of the swimming capacity expressed as the total swim distance (n = 27–40, performed in two independent experiments). Two-way ANOVA followed by Tukey’s multiple comparison test demonstrates no statistically significant difference between injured SB225002- and DMSO-treated Rac2D57N larvae at 1 (p = 0.9991), 2 (p = 0.9958), 3 (p = 0.9368) and 5 dpi (p = 0.9930). Statistically significant differences are observed between injured and uninjured DMSO-treated larvae (grey pounds) at 1 (p < 0.0001), 2 (p < 0.0001) and 3 dpi (p = 0.0362), as well as between injured SB225002- and uninjured DMSO-treated larvae (green pounds) at 1 (p < 0.0001) and 2 dpi (p < 0.0001). (P, Q) Representative maximal projections of Rac2D57N injured spinal cord, treated with DMSO or AMD3100, display the axonal bridge. Scale bar, 30 μm. (R) Quantification of the axonal bridge shows no statistically significant difference between AMD3100- and DMSO-treated Rac2D57N larvae, analyzed via unpaired two-tailed t-test (p = 0.8312) (n = 22–26, performed in two independent experiments). (S) Recovery of the swimming capacity expressed as the total swim distance (n = 24–39, performed in three independent experiments). Two-way ANOVA followed by Tukey’s multiple comparison test reveals no statistically significant difference between injured AMD3100- and DMSO-treated larvae at 1 (p = 0.7483), 2 (p > 0.9999), 3 (p = 0.9473) and 5 dpi (p = 0.7990). Statistically significant differences are found between injured and uninjured DMSO-treated larvae (grey pounds) at 1 (p < 0.0001) and 2 dpi (p < 0.0001), as well as between injured AMD3100- and uninjured DMSO-treated larvae (orange pounds) at 1 dpi (p < 0.0001) and 2 dpi (p < 0.0001).