FIGURE SUMMARY
Title

Muscone abrogates breast cancer progression through tumor angiogenic suppression via VEGF/PI3K/Akt/MAPK signaling pathways

Authors
Wang, D., Liu, X., Hong, W., Xiao, T., Xu, Y., Fang, X., Tang, H., Zheng, Q., Meng, X.
Source
Full text @ Cancer Cell Int.

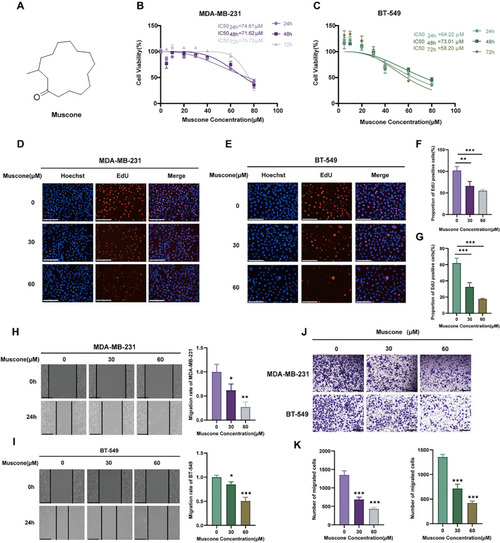
Muscone diminishes BC cell proliferation and migration in vitro. A The chemical muscone configuration. B, C The muscone-mediated regulation of BC cell survivability (MDA-MB-231 and BT-549) as detected via CCK-8 assessment. DG Representative images and quantification of EdU proliferation assays performed in BC cells exposed to vehicle or specified muscone concentrations; scale bar, 500 µm. H, I Scratch wound assays of monolayers of BC cells; scale bar, 1000 µm. J, K The muscone-mediated regulation of BC cell migration, as detected by Transwell cell migration assay. Typical depiction (J) and quantification of migrated BC cell quantity (K); scale bar: 1250 µm. Data is shown in mean ± SEM. n = 3. *P < 0.05, **P < 0.01, and ***P < 0.001

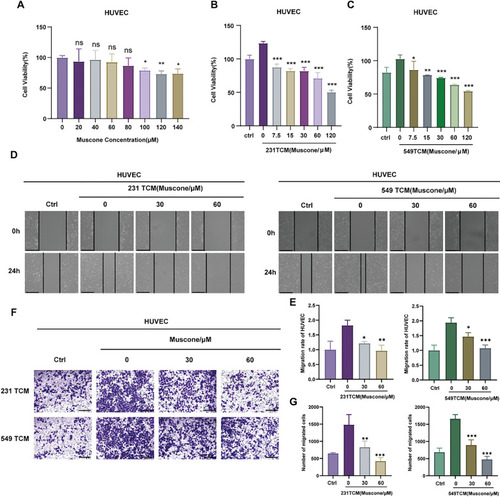
Muscone suppresses TCM-induced HUVECs proliferation and migration in cellular models. A The muscone-based regulation of HUVECs viability, as assessed via CCK-8 assays. B, C Influence of TCM-exposed MDA-MB-231 and BT-549 cells pretreated with muscone on HUVECs viability, as detected via CCK-8 assays. D, E Scratch wound assay of HUVEC cells treated with TCM from tumor cells pretreated with muscone; Scale bar, 1000 µm. F, G The influence of TCM from cells pretreated with muscone on HUVECs cell migration, as detected via Transwell cell migration assays. Typical representation (F) and quantification of migrated HUVECs quantity (G). Scale bar: 1250 µm. Data is shown as mean ± SEM. n = 3. *P < 0.05, **P < 0.01, and ***P < 0.001 vs TCM from untreated cells

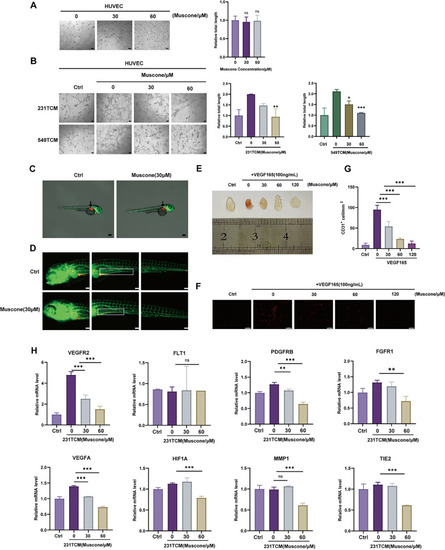
Muscone abrogates tumor angiogenesis in cellular and animal models. A, B Tube formation in vitro of HUVECs treated with muscone (A), or TCM from muscone-treated MDA-MB-231 cells (231TCM) or BT-549 cells (549TCM) (B). Tube lengths were measured with Fiji imaging software; Scale bar, 100 µm. C Equal numbers of Dil-labelled and incorporated MDA-MB-231 cells were administered into the zebrafish embryos perivitelline space at 48 h after fertilization. Arrows mark the administration locations. Magnification: 28.5 × . D Vasculature and neo-angiogenesis around the primary tumor and metastasis locations in zebrafish treated with muscone for 48 h. Boxes indicate newly formed tumor vessels. Magnification: 100 × . E Photographs of the Matrigel plugs from mice treated with VEGF and muscone for 12 d. F Representative images of immunofluorescent CD31+ microvessels (red) within Matrigel plugs; Scale bar, 100 µm. G Microvessel densities quantified as the density of CD31+ cells. H The effect of TCM from muscone-treated MDA-MB-231 cells (231TCM) on tumor angiogenesis-related gene expression in HUVECs. All data are shown as mean ± SEM, n = 3, *P < 0.05, **P < 0.01, and ***P < 0.001

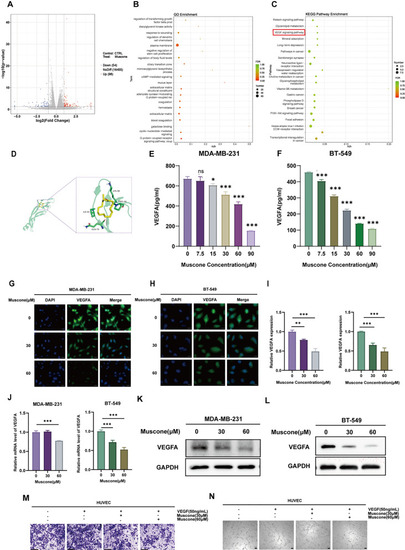
Muscone inhibits the VEGF axis in breast cancer (BC) cells. A Volcano plot of DEGs between control and muscone-treated MDA-MB-231 cells. Threshold was set at |log2FoldChange|> 1 and P < 0.05. Blue and red dots reflect diminished and elevated DEGs, respectively, by muscone treatment. B DEGs GO axis enrichment assessment. C DEGs KEGG network enrichment assessment. D Muscone interaction modes and locations with VEGFA, as estimated by AutoDock Vina software. E, F VEGFA secretion from BC cells was quantified by ELISA. G, H Cellular immunofluorescence (IF) assessments were conducted to assess VEGFA protein content in muscone-treated BC cells; Scale bar, 20 µm. I, J Western blot assessment of the muscone-mediated regulation of VEGFA protein levels in BC cells. K, L VEGFA transcript expression in BC cells as detected by RT-qPCR. M Muscone-mediated regulation of VEGF165-stimulated HUVECs migration as detected via Transwell cell migration assay; Scale bar, 1250 µm. N The muscone-mediated regulation of VEGF165-induced tube formation of HUVECs; Scale bar, 100 µm. Data shown as mean ± SEM. n = 3. *P < 0.05, **P < 0.01, and ***P < 0.001

Muscone suppresses VEGFR2/PI3K/Akt/MAPK axis molecule activation in HUVECs. A Western blot assessment of VEGFR2, PLCγ1, Akt, JNK and ERK protein phosphorylation in HUVECs treated with TCM from muscone-pretreated MDA-MB-231 (231TCM) or BT-549 cells (549TCM). BD Pharmacological inhibition of VEGFR signaling in HUVECs as determined by Western blot assessment. Cells were pre-exposed to the VEGFR2 inhibitor SU5416 (B), PI3K inhibitor LY294002 (C) or MAPK inhibitor PD98509 (D) for 1 h prior to stimulation with VEGF and muscone. EG The effects of co-treatment with muscone and SU5416, LY294002, or PD98059 on VEGF-stimulated tube formation of HUVECs. The total tubular structure length was imaged and quantified via Fiji imaging software; Scale bar, 100 μm. Data provided as mean ± SEM. n = 3. *P < 0.05, **P < 0.01, and ***P < 0.001

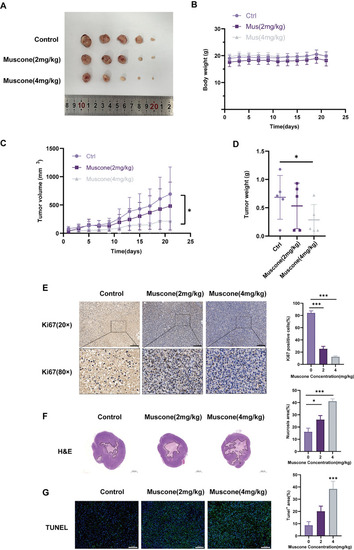
Muscone abolishes tumor development in a mouse breast cancer (BC) xenograft model. A Image of MDA-MB-231 tumors from different groups. B Body weights were recorded once every 2 days for 21 d. C Tumor volumes were computed once every 2 days. D Dissected tumor weights were accurately documented. E Representative immunohistochemical (IHC) Ki67 staining in MDA-MB-231 xenograft tumors; Scale bar, 200 µm. F Tumor tissue H&E staining; Scale bar, 2000 µm. G Tumor tissue TUNEL staining; Scale bar, 100 µm. Representative staining images and quantification. Data provided as mean ± SEM. n = 5 mice per group. *P < 0.05, **P < 0.01, and ***P < 0.001

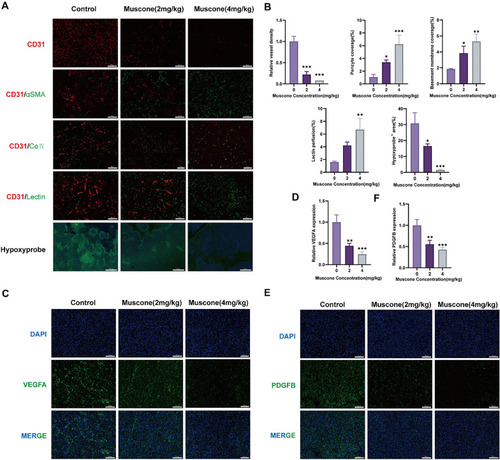
Muscone suppresses tumor angiogenesis. A, B Immunofluorescence (IF) images of tumor stained for CD31, αSMA, collagen IV (Col4), lectin, and hypoxyprobe in MDA-MB-231 xenograft tumors; Scale bar of CD31, αSMA, collagen IV (Col4) and lectin, 100 µm, scale bar of hypoxyprobe, 500 µm. Branching index, pericyte coverage, basement membrane coverage, lectin perfusion and hypoxic areas were recorded via Fiji, and quantitative data are provided as mean ± SEM. CF IF pictures of VEGFA and PDGFB in MDA-MB-231 xenograft tumors; Scale bar, 100 μm. Representative staining images and quantification. Data provided as mean ± SEM. n = 5 mice per cohort. *P < 0.05, **P < 0.01, and ***P < 0.001

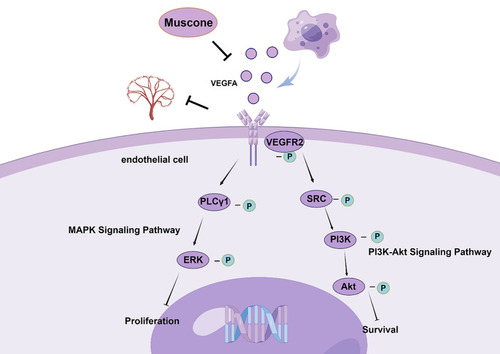
Schematic model illustrating the antiangiogenic mechanisms of muscone (by Figdraw)

Acknowledgments
This image is the copyrighted work of the attributed author or publisher, and ZFIN has permission only to display this image to its users. Additional permissions should be obtained from the applicable author or publisher of the image. Full text @ Cancer Cell Int.