
- Title
-
A chronic signaling TGFb zebrafish reporter identifies immune response in melanoma
- Authors
- Noonan, H.R., Thornock, A.M., Barbano, J., Xifaras, M.E., Baron, C.S., Yang, S., Koczirka, K., McConnell, A.M., Zon, L.I.
- Source
- Full text @ Elife
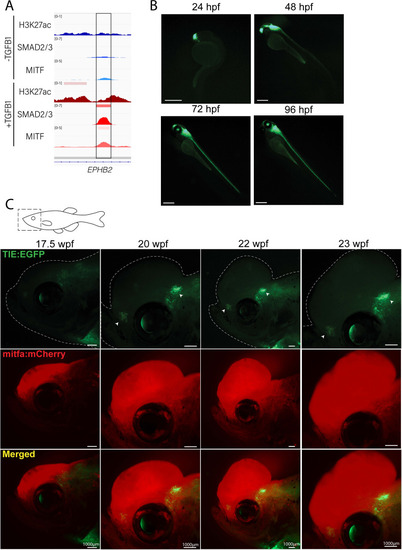
Novel TIE:EGFP zebrafish enhancer reporter is expressed in advanced melanomas. (A) TGFb-induced enhancer (TIE) used to construct TIE:EGFP reporter determined by H3K27ac, SMAD2/3, and MITF ChIP-seq peaks in A375s+/-TGFB1. There is unique H3K27ac and SMAD2/3 binding upon stimulus. (B) TIE:EGFP expression throughout zebrafish development. Scale bars represent 500 µm. (C) TIE:EGFP expression across melanomagenesis indicated by arrowheads. Representative images shown. Additional tumors shown in Figure 1—figure supplement 3. Illustrated fish diagram in (C) created with BioRender.com, and published using a CC BY-NC-ND license with permission. |
( |
Treatment with human recombinant TGFB1 activates the TGFb pathway in human melanoma cells. ( |
Clusters of |
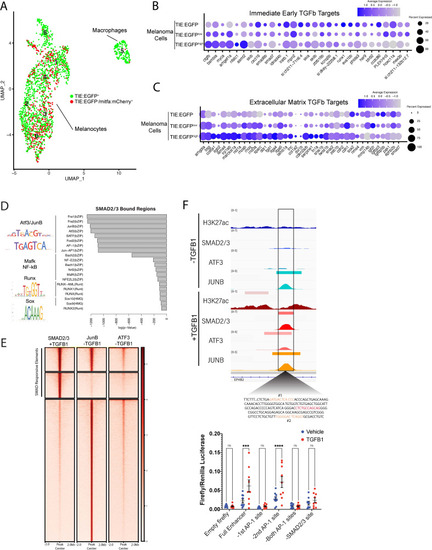
TGFb responsive melanoma cells in MCR:MCS tumors up-regulate chronic extracellular matrix TGFb target genes and AP-1 binding is required for TGFb responsiveness. (A) (Left) UMAP depicting seven cell clusters identified by SORT-seq, combined two MCR:MCS biological replicates. Approximately 2256 TIE:EGFP+ cells and 752 mitfa:mCherry+;TIE:EGFP- cells (as a control) were sorted by flow cytometry for scRNA-seq. TIE:EGFP+ cells were both mitfa:mCherry+ and mitfa:mCherry-. In analysis of the scRNA-seq data, melanoma cells were identified as being mitfa and sox10 positive, while macrophages were identified as mpeg1.1 and marco positive. (B) Dotplot depicting TGFb immediate-early target gene expression in TIE:EGFPhigh, TIE:EGFPlow, and TIE:EGFP- melanoma cells. Melanoma cells can be segregated into TIE:EGFPhigh vs. TIE:EGFPlow based on EGFP intensity during sorting. (C) Dotplot depicting extracellular matrix TGFb target gene expression in TIE:EGFPhigh, TIE:EGFPlow, and TIE:EGFP- melanoma cells. (D) HOMER motif analysis of regulatory regions bound by SMAD2/3 upon stimulation in A375 cells. (E) Heatmap showing binding of JUNB and ATF3 pre-stimulus at 12,000 SMAD2/3-responsive elements in A375. (F) (Top) IGV plot of H3K27ac, SMAD2/3, ATF3 and JUNB ChIP-seq +/- TGFB1 stimulus at the TGFb-induced enhancer. Inset depicts sequence under SMAD2/3 ChIP-seq peak and highlights AP-1 (orange) and SMAD2/3 (red) binding sites. (Bottom) Firefly luciferase luminescence of full TIE reporter or reporter lacking AP-1 or SMAD2/3 sites. Normalized to Renilla transfection control. Experiment performed three times with three technical replicates each. A two-way multiple comparison ANOVA was used to calculate significance. |
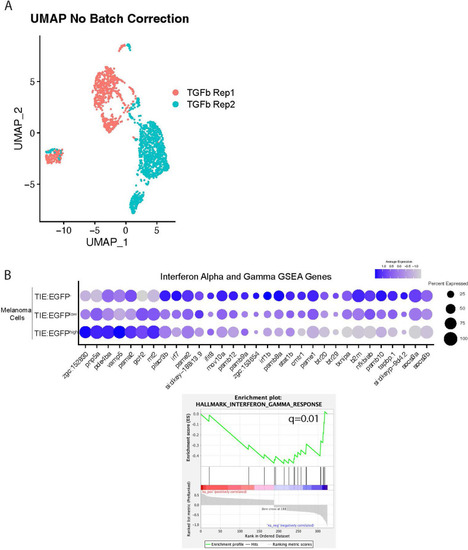
TGFb responsive melanoma cells down-regulate interferon target genes. ( |
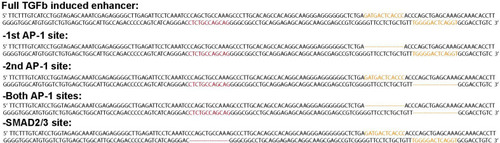
Mutated TGFb inducible enhancer sequences used for luciferase assays in AP-1 motifs are in orange, SMAD2/3 motif is in red. |
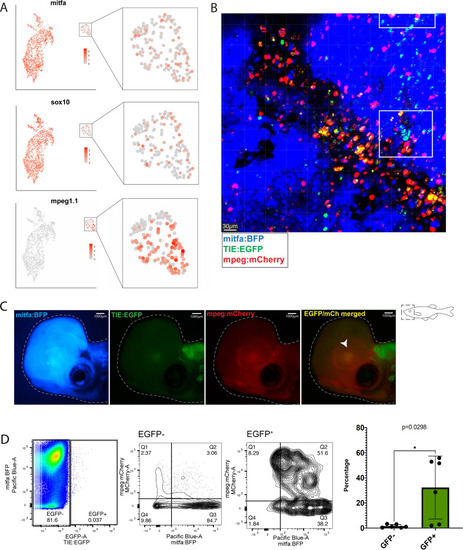
Macrophages preferentially phagocytose TIE:EGFP+ cells. (A) UMAP depicting mitfa, sox10, and mpeg1.1 expression in clusters identified by SORT-seq, combined two MCR:MCS melanoma replicates. Inset shows expression of these genes in the macrophage cluster. (B) Representative image from a zebrafish melanoma acquired on an upright confocal, n=13 fish. Additional images shown in Figure 3—figure supplement 1. Melanoma cells are blue, macrophages are red, and TIE:EGFP+ cells are green. Yellow indicates a macrophage that has phagocytosed a TGFb responsive cell, which often appears as fragments within macrophages. A macrophage that expresses the TIE:EGFP endogenously would express EGFP throughout the entire cell, rather than in fragments. Cyan indicates a TIE:EGFP+ melanoma cell. When phagocytosed by macrophages, TIE:EGFP+ melanoma cells appear white, which are indicated within in the white boxes. (C) Representative TIE:EGFP+;mpeg:mCherry+;mitfa:BFP+ melanoma used for flow analysis of macrophages. Scale bars indicate 1000 µm. The EGFP+ region adjacent to the tumor is endogenous TIE:EGFP+ expression of the brain. (D) (Far left) Viable cells were separated into TIE:EGFP- and TIE:EGFP+. (Middle) FACS plots showing TIE:EGFP- and TIE:EGFP+ cells relative to mpeg:mCherry and mitfa:BFP. Q1 in the TIE:EGFP- plot represents macrophages that have not phagocytosed any melanoma cells. Q2 represents macrophages that have phagocytosed TIE:EGFP- melanoma cells. Q1 in the TIE:EGFP+ plot represents macrophages that have not phagocytosed melanoma cells, but rather express the TIE:EGFP reporter endogenously or phagocytosed a TIE:EGFP+ non-melanoma cell. Q2 represents macrophages that have phagocytosed TIE:EGFP+ melanoma cells. (Far right) Q2 of both plots are graphed to represent the percentage of all TIE:EGFP- or TIE:EGFP+ live cells that are melanoma cells phagocytosed by macrophages. Two-tailed unpaired Welch’s t-test was used to calculate significance. n=3 fish with two technical replicates each. Illustrated fish diagram in (C) created with BioRender.com, and published using a CC BY-NC-ND license with permission. |
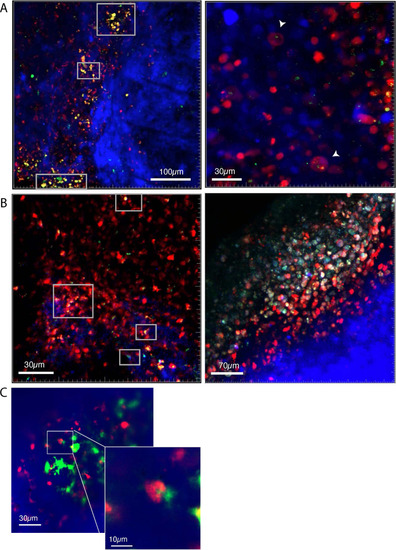
Macrophages phagocytose Representative images showing several zebrafish melanomas acquired on an upright confocal microscope. Fish were anesthetized using tricaine and images were acquired of tumors in live fish. Melanoma cells are blue, macrophages are red, and |
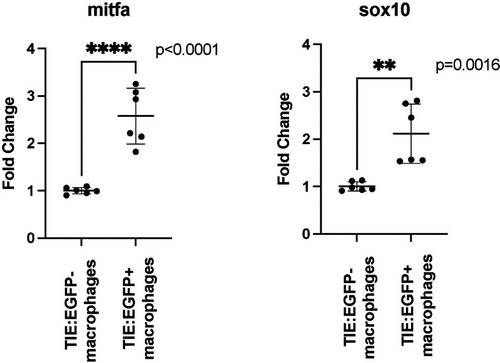
qPCR shows that Two |
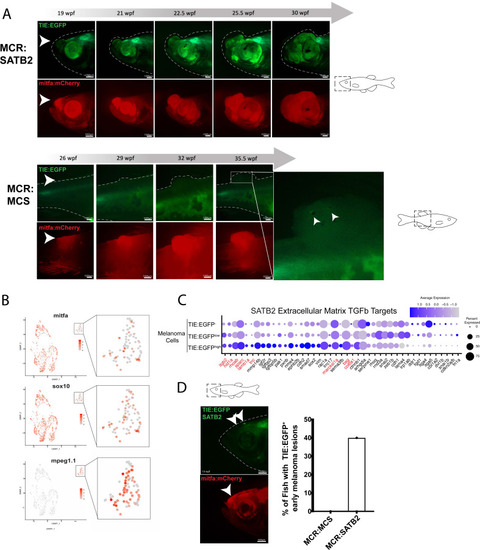
SATB2 expressing melanomas exhibit TIE:EGFP expression in early initiating lesions. (A) (Top) Development of a representative tumor overexpressing MCR:SATB2 in TIE:EGFP;Tg(mitfa:BRAFV600E);p53-/-;mitfa-/- zebrafish. Arrowhead indicates TIE:EGFP+ early melanoma before tumor formation. This EGFP+ region is separate from the endogenous TIE:EGFP+ expression of the brain. (Bottom) Development of a control MCR:MCS tumor in TIE:EGFP;Tg(mitfa:BRAFV600E);p53-/-;mitfa-/- zebrafish, for reference. (B) UMAP depicting mitfa, sox10, and mpeg1.1 expression in clusters identified by SORT-seq of SATB2 expressing tumor in (A). Inset shows expression of these genes in the macrophage cluster. (C) Dotplot depicting extracellular matrix TGFb target gene expression in TIE:EGFPhigh, TIE:EGFPlow, and TIE:EGFP- SATB2 expressing melanoma cells. Genes shown in red are genes that are also upregulated in control MCR:MCS tumors. (D) Early initiating melanoma (arrowhead) overexpressing MCR:SATB2 in TIE:EGFP;Tg(mitfa:BRAFV600E);p53-/-;mitfa-/- zebrafish. Representative image chosen. 40% of MCR:SATB2 early melanomas (n=27) express TIE:EGFP, compared to 0% of MCR:MCS early melanomas (n=56) (quantification on right). Illustrated fish diagrams in (A, D) created with BioRender.com, and published using a CC BY-NC-ND license with permission. |
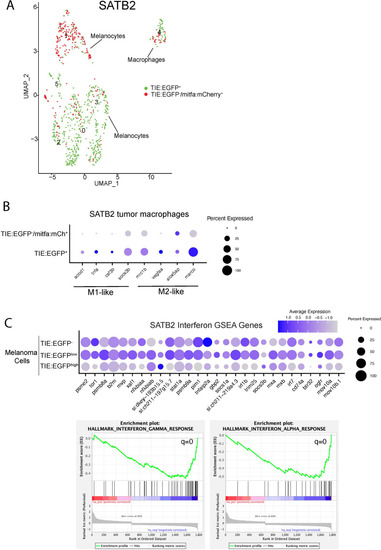
Single-cell RNA-seq identifies ( |