Image
Figure Caption

Figure 4—figure supplement 1. 
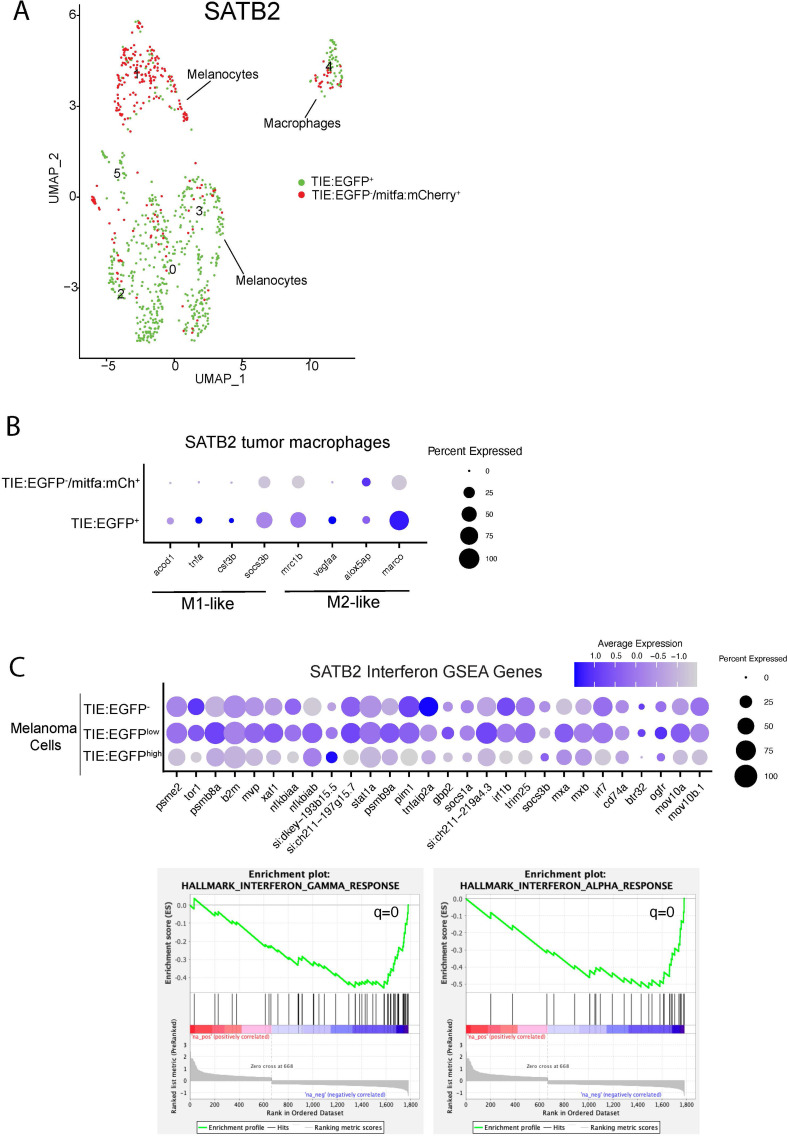
Single-cell RNA-seq identifies TIE:EGFP+ macrophages and melanoma cells in an MCR:SATB2 tumor.

(A) (Left) UMAP depicting six cell clusters identified by SORT-seq. Approximately 867 TIE:EGFP+ cells and 376 mitfa:mCherry+;TIE:EGFP- cells (as a control) were sorted into individual wells using flow cytometry. TIE:EGFP+ cells were both mitfa:mCherry+ and mitfa:mCherry-. In scRNA-seq data analysis, melanoma cells were identified as being mitfa and sox10 positive, while macrophages were identified as mpeg1.1 and marco positive. (B) Macrophages were subset from the UMAP, and this dotplot depicts M1-like and M2-like transcriptional marker expression in TIE:EGFP+ and TIE:EGFP- macrophages. The top row indicates TIE:EGFP- macrophages (which happen to be mitfa:mCherry+ because they phagocytosed TIE:EGFP- melanoma cells). The bottom row indicates macrophages that express TIE:EGFP endogenously or phagocytosed TIE:EGFP+ cells. Some of these macrophages expressed mitfa:mCherry, representing macrophages that had phagocytosed TIE:EGFP+ melanoma cells. (C) (Top) Dotplot depicting expression of interferon alpha and gamma GSEA pathway genes in TIE:EGFPhigh, TIE:EGFPlow, and TIE:EGFP- melanoma cells. (Bottom) GSEA enrichment plots reveal down-regulated interferon alpha (q=0) and gamma (q=0.0) in TIE:EGFP+ melanoma cells.

Acknowledgments
This image is the copyrighted work of the attributed author or publisher, and ZFIN has permission only to display this image to its users. Additional permissions should be obtained from the applicable author or publisher of the image. Full text @ Elife