
Figure 1—figure supplement 1.
- ID
- ZDB-FIG-240617-41
- Publication
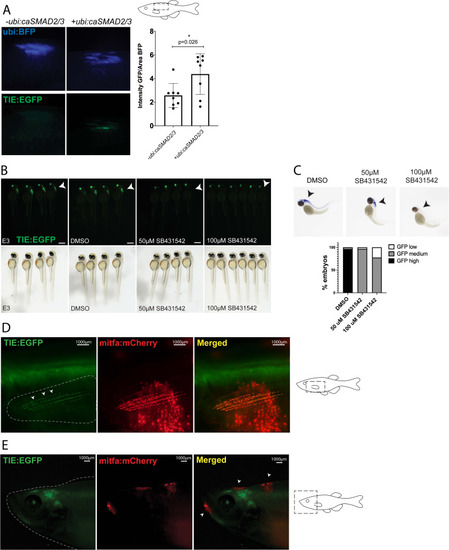
- Noonan et al., 2024 - A chronic signaling TGFb zebrafish reporter identifies immune response in melanoma
- Other Figures
- All Figure Page
- Back to All Figure Page
( |