
Figure 3
- ID
- ZDB-FIG-240617-47
- Publication
- Noonan et al., 2024 - A chronic signaling TGFb zebrafish reporter identifies immune response in melanoma
- Other Figures
- All Figure Page
- Back to All Figure Page
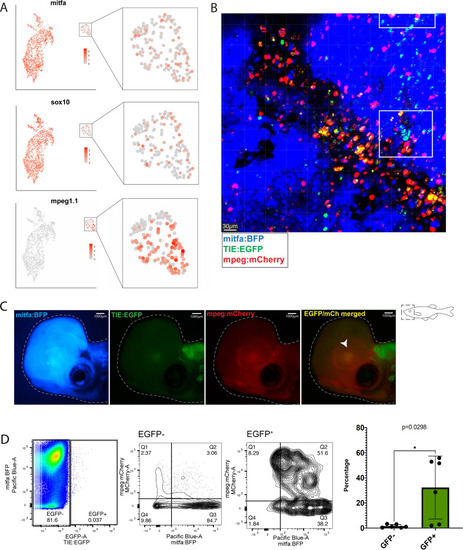
Macrophages preferentially phagocytose TIE:EGFP+ cells. (A) UMAP depicting mitfa, sox10, and mpeg1.1 expression in clusters identified by SORT-seq, combined two MCR:MCS melanoma replicates. Inset shows expression of these genes in the macrophage cluster. (B) Representative image from a zebrafish melanoma acquired on an upright confocal, n=13 fish. Additional images shown in Figure 3—figure supplement 1. Melanoma cells are blue, macrophages are red, and TIE:EGFP+ cells are green. Yellow indicates a macrophage that has phagocytosed a TGFb responsive cell, which often appears as fragments within macrophages. A macrophage that expresses the TIE:EGFP endogenously would express EGFP throughout the entire cell, rather than in fragments. Cyan indicates a TIE:EGFP+ melanoma cell. When phagocytosed by macrophages, TIE:EGFP+ melanoma cells appear white, which are indicated within in the white boxes. (C) Representative TIE:EGFP+;mpeg:mCherry+;mitfa:BFP+ melanoma used for flow analysis of macrophages. Scale bars indicate 1000 µm. The EGFP+ region adjacent to the tumor is endogenous TIE:EGFP+ expression of the brain. (D) (Far left) Viable cells were separated into TIE:EGFP- and TIE:EGFP+. (Middle) FACS plots showing TIE:EGFP- and TIE:EGFP+ cells relative to mpeg:mCherry and mitfa:BFP. Q1 in the TIE:EGFP- plot represents macrophages that have not phagocytosed any melanoma cells. Q2 represents macrophages that have phagocytosed TIE:EGFP- melanoma cells. Q1 in the TIE:EGFP+ plot represents macrophages that have not phagocytosed melanoma cells, but rather express the TIE:EGFP reporter endogenously or phagocytosed a TIE:EGFP+ non-melanoma cell. Q2 represents macrophages that have phagocytosed TIE:EGFP+ melanoma cells. (Far right) Q2 of both plots are graphed to represent the percentage of all TIE:EGFP- or TIE:EGFP+ live cells that are melanoma cells phagocytosed by macrophages. Two-tailed unpaired Welch’s t-test was used to calculate significance. n=3 fish with two technical replicates each. Illustrated fish diagram in (C) created with BioRender.com, and published using a CC BY-NC-ND license with permission. |