
|
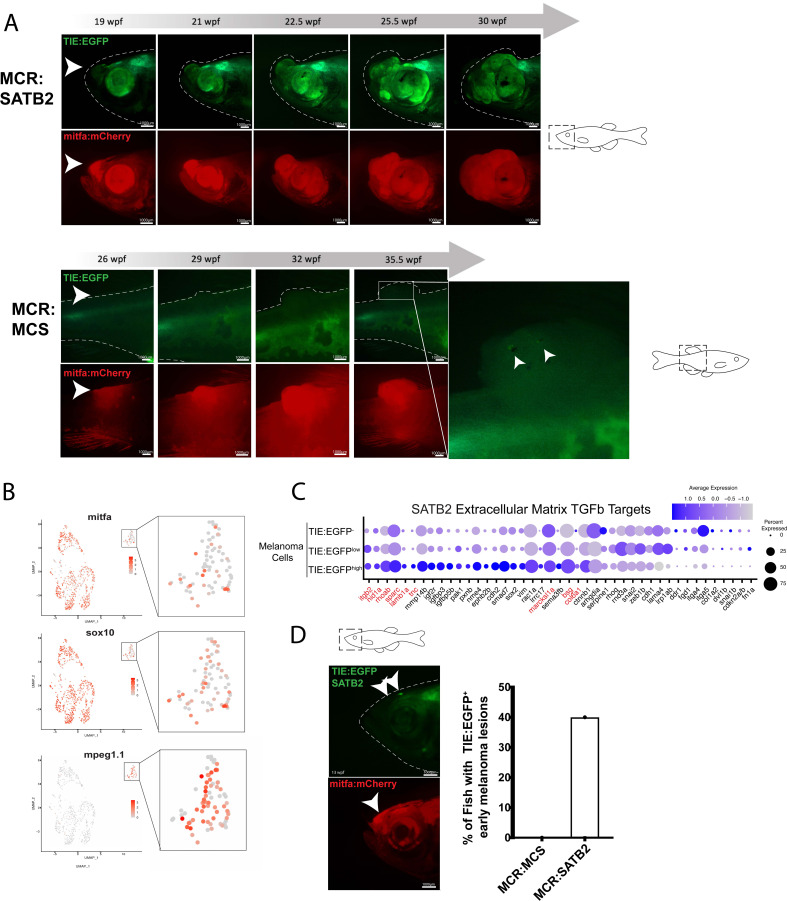
Figure 4 SATB2 expressing melanomas exhibit TIE:EGFP expression in early initiating lesions. (A) (Top) Development of a representative tumor overexpressing MCR:SATB2 in TIE:EGFP;Tg(mitfa:BRAFV600E);p53-/-;mitfa-/- zebrafish. Arrowhead indicates TIE:EGFP+ early melanoma before tumor formation. This EGFP+ region is separate from the endogenous TIE:EGFP+ expression of the brain. (Bottom) Development of a control MCR:MCS tumor in TIE:EGFP;Tg(mitfa:BRAFV600E);p53-/-;mitfa-/- zebrafish, for reference. (B) UMAP depicting mitfa, sox10, and mpeg1.1 expression in clusters identified by SORT-seq of SATB2 expressing tumor in (A). Inset shows expression of these genes in the macrophage cluster. (C) Dotplot depicting extracellular matrix TGFb target gene expression in TIE:EGFPhigh, TIE:EGFPlow, and TIE:EGFP- SATB2 expressing melanoma cells. Genes shown in red are genes that are also upregulated in control MCR:MCS tumors. (D) Early initiating melanoma (arrowhead) overexpressing MCR:SATB2 in TIE:EGFP;Tg(mitfa:BRAFV600E);p53-/-;mitfa-/- zebrafish. Representative image chosen. 40% of MCR:SATB2 early melanomas (n=27) express TIE:EGFP, compared to 0% of MCR:MCS early melanomas (n=56) (quantification on right). Illustrated fish diagrams in (A, D) created with BioRender.com, and published using a CC BY-NC-ND license with permission.