Image
Figure Caption

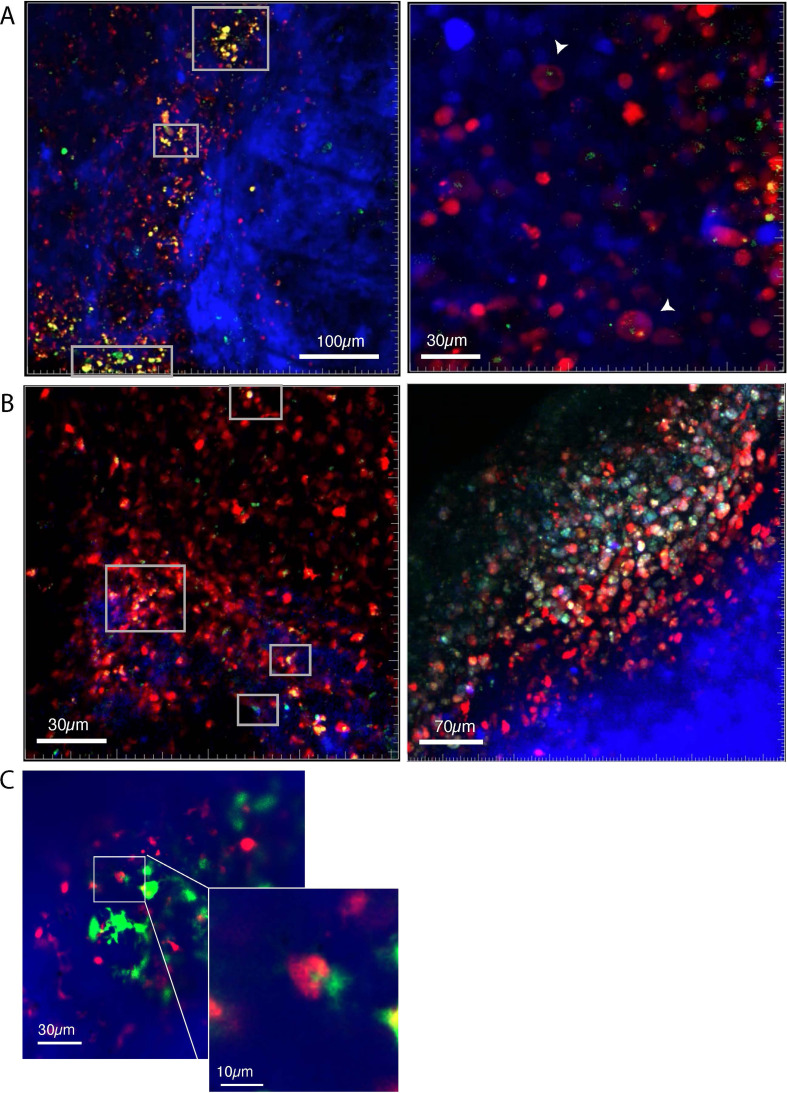
Figure 3—figure supplement 1. Macrophages phagocytose TIE:EGFP+ cells.

Representative images showing several zebrafish melanomas acquired on an upright confocal microscope. Fish were anesthetized using tricaine and images were acquired of tumors in live fish. Melanoma cells are blue, macrophages are red, and TIE:EGFP+ cells are green. Yellow indicates TIE:EGFP+ macrophages, which results from endogenous reporter expression or from phagocytosis of a TIE:EGFP+ cell, in which case yellow signal appears as fragments within macrophages. Cyan indicates a TIE:EGFP+ melanoma cell. When phagocytosed by macrophages, TIE:EGFP+ melanoma cells appear white because of mitfa:BFP, TIE:EGFP, and mpeg:mCh co-localization. (A) (Left) White boxes indicate diffusely yellow macrophages that express TIE:EGFP endogenously. (Right) Higher magnification in a different tumor shows that TIE:EGFP+ fragments are contained in macrophages occasionally in endosome-like structures, seen most clearly by the cell indicated by the lowest white arrowhead. Z projection, single frame. (B) (Left) White cells (indicating macrophages that have phagocytosed TIE:EGFP+ melanoma cells) are indicated within white boxes. (Right) A TIE:EGFP+ patch in a separate tumor is composed of macrophages engaged with TIE:EGFP+ tumor cells. White signal represents mpeg:mCh+ macrophages that have engulfed TIE:EGFP+ mitfa:BFP+ tumor cells. Z projection, single frame. (C) Image of a macrophage actively phagocytosing a TIE:EGFP+ cell in a tumor. Image taken via optical sectioning, single frame. In total, n=13 tumors analyzed by confocal microscopy.

Acknowledgments
This image is the copyrighted work of the attributed author or publisher, and ZFIN has permission only to display this image to its users. Additional permissions should be obtained from the applicable author or publisher of the image. Full text @ Elife