
|
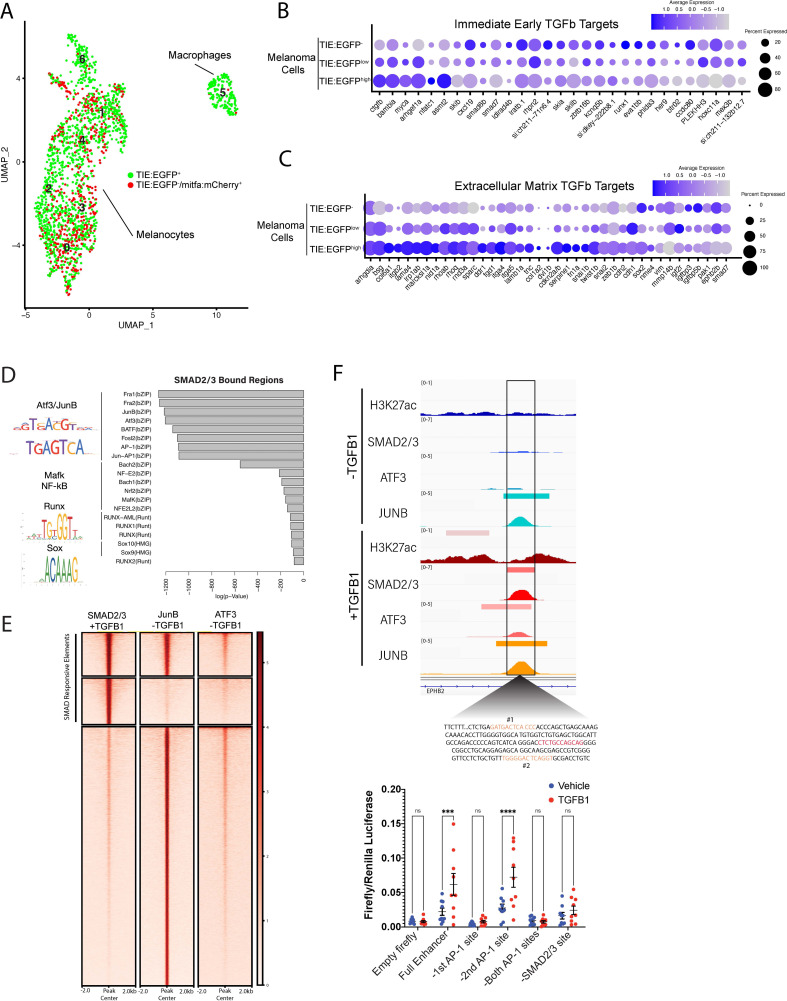
Figure 2 TGFb responsive melanoma cells in MCR:MCS tumors up-regulate chronic extracellular matrix TGFb target genes and AP-1 binding is required for TGFb responsiveness. (A) (Left) UMAP depicting seven cell clusters identified by SORT-seq, combined two MCR:MCS biological replicates. Approximately 2256 TIE:EGFP+ cells and 752 mitfa:mCherry+;TIE:EGFP- cells (as a control) were sorted by flow cytometry for scRNA-seq. TIE:EGFP+ cells were both mitfa:mCherry+ and mitfa:mCherry-. In analysis of the scRNA-seq data, melanoma cells were identified as being mitfa and sox10 positive, while macrophages were identified as mpeg1.1 and marco positive. (B) Dotplot depicting TGFb immediate-early target gene expression in TIE:EGFPhigh, TIE:EGFPlow, and TIE:EGFP- melanoma cells. Melanoma cells can be segregated into TIE:EGFPhigh vs. TIE:EGFPlow based on EGFP intensity during sorting. (C) Dotplot depicting extracellular matrix TGFb target gene expression in TIE:EGFPhigh, TIE:EGFPlow, and TIE:EGFP- melanoma cells. (D) HOMER motif analysis of regulatory regions bound by SMAD2/3 upon stimulation in A375 cells. (E) Heatmap showing binding of JUNB and ATF3 pre-stimulus at 12,000 SMAD2/3-responsive elements in A375. (F) (Top) IGV plot of H3K27ac, SMAD2/3, ATF3 and JUNB ChIP-seq +/- TGFB1 stimulus at the TGFb-induced enhancer. Inset depicts sequence under SMAD2/3 ChIP-seq peak and highlights AP-1 (orange) and SMAD2/3 (red) binding sites. (Bottom) Firefly luciferase luminescence of full TIE reporter or reporter lacking AP-1 or SMAD2/3 sites. Normalized to Renilla transfection control. Experiment performed three times with three technical replicates each. A two-way multiple comparison ANOVA was used to calculate significance.