
- Title
-
egr3 is a mechanosensitive transcription factor gene required for cardiac valve morphogenesis
- Authors
- da Silva, A.R., Gunawan, F., Boezio, G.L.M., Faure, E., Théron, A., Avierinos, J.F., Lim, S., Jha, S.G., Ramadass, R., Guenther, S., Looso, M., Zaffran, S., Juan, T., Stainier, D.Y.R.
- Source
- Full text @ Sci Adv
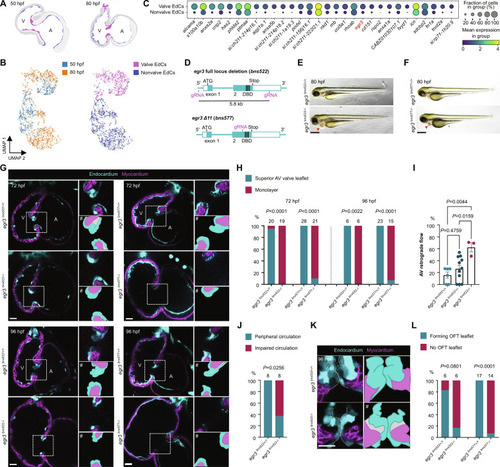
Egr3 is required for cardiac valve formation. ( EXPRESSION / LABELING:
PHENOTYPE:
|
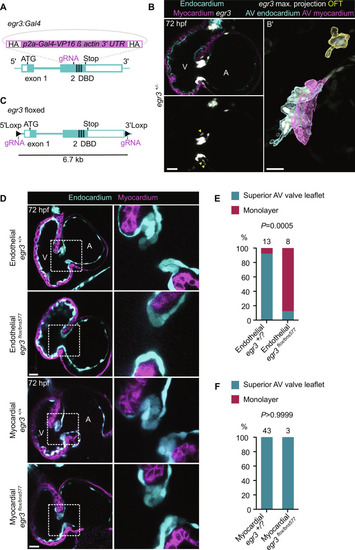
Endothelial-specific deletion of ( EXPRESSION / LABELING:
PHENOTYPE:
|
( |
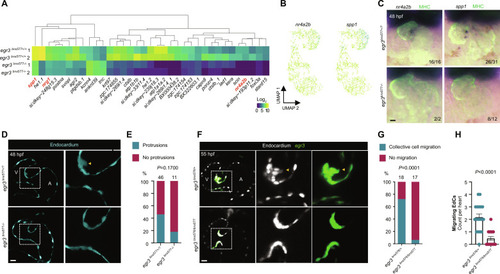
( EXPRESSION / LABELING:
PHENOTYPE:
|
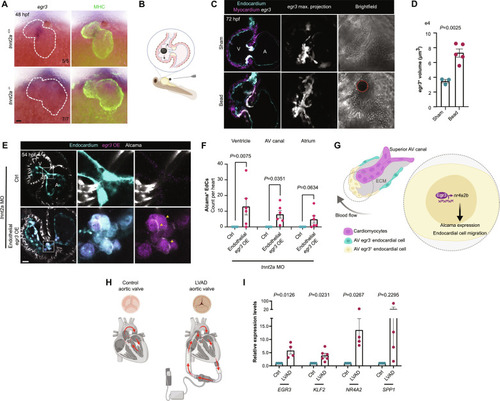
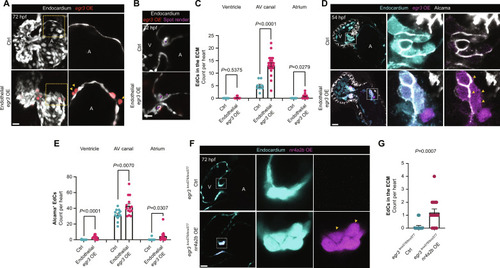
( EXPRESSION / LABELING:
PHENOTYPE:
|