|
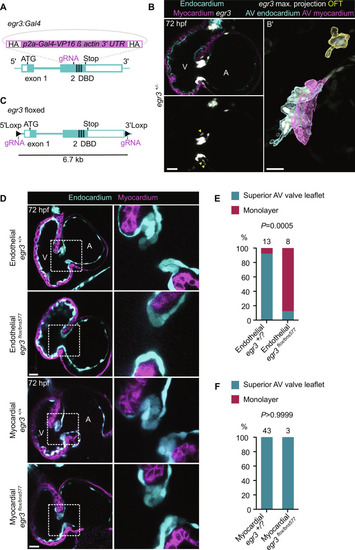
Endothelial-specific deletion of egr3 recapitulates the global mutant phenotype (A) Schematic of the knock-in reporter [Pt(egr3:Gal4-VP16)] generated by inserting Gal4-VP16 in exon 2 of egr3. (B) Pt(egr3:Gal4-VP16); Tg(UAS:eGFP) expression (gray) at 72 hpf; EdCs are marked by Tg(kdrl:Hsa.HRAS-mCherry) expression (cyan) and myocardial cells by Tg(myl7:BFP-CAAX) expression (magenta); yellow arrowheads point to AV canal egr3 reporter+ cardiomyocytes. (B′) Maximum projection of Pt(egr3:Gal4-VP16); Tg(UAS:eGFP) expression with image segmentation of egr3 reporter+ AV canal EdCs (cyan), egr3 reporter+ AV canal myocardial cells (magenta), and egr3 reporter+ OFT cells (yellow). (C) Schematic of egr3 floxed allele Pt(egr3:loxP-egr3-loxP). (D) Confocal images of representative hearts from 72 hpf egr3+/+, endothelial cell–specific egr3−/−, and myocardial cell–specific egr3−/− larvae using the egr3 floxed allele line. (E and F) Percentage of 72 hpf egr3+/?, endothelial cell–specific egr3−/− (E), and myocardial cell–specific egr3−/− (F) larvae with a superior valve leaflet and without a superior valve leaflet (i.e., endocardial monolayer); one and two independent experiments, respectively; Fisher’s exact test. Scale bars, 20 μm.
|