|
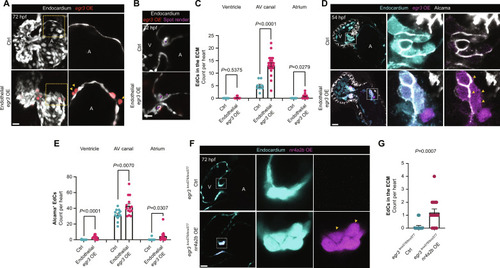
egr3 triggers EdC migration and Alcama expression (A) 3D reconstruction of representative hearts from control [Tg(fli1a:Gal4);Tg(UAS:Kaede)] and endothelial-specific egr3-overexpressing [Tg(fli1a:Gal4);Tg(UAS:Kaede);Tg(UAS:egr3-p2a-dTomato)] 72 hpf larvae; magnified regions show single z planes of the atrium from control and endothelial-specific egr3-overexpressing 72 hpf larvae; yellow arrowheads point to Tg(UAS:egr3-p2a-dTomato)+ atrial EdCs in the adjacent ECM. (B) Confocal images of representative AV VIC quantification through the spot render function in Imaris; VICs (magenta spots). (C) Quantification of EdCs present in the ECM per cardiac region in 72 hpf endothelial-specific egr3-overexpressing larvae; n = 9 control and 22 egr3 OE larvae, n = 0 and 0.14 EdCs (ventricle), n = 5 and 13.36 EdCs (AV canal), n = 0 and 0.59 EdCs (atrium). (D) Confocal images of representative hearts from control [Tg(fli1a:Gal4);Tg(UAS:Kaede)] and endothelial-specific egr3-overexpressing [Tg(fli1a:Gal4);Tg(UAS:Kaede);Tg(UAS:egr3-p2a-dTomato)] 54 hpf embryos immunostained for Alcama; magnified regions show Alcama+ cells in the AV canal of the control heart and in the atrium of the Tg(UAS:egr3-p2a-dTomato) heart. (E) Quantification of Alcama+ EdCs per cardiac region of control and endothelial-specific egr3-overexpressing embryos at 54 hpf; n = 13 control and 14 egr3 OE embryos, n = 0.07 and 3.28 EdCs (ventricle), n = 31.77 and 42.86 EdCs (AV canal), n = 0.38 and 4.71 EdCs (Atrium); three independent experiments. (F) Confocal images of representative hearts from control Pt(egr3:Gal4-VP16) and egr3-driven nr4a2b-overexpressing [Pt(egr3:Gal4-VP16); Tg(UAS:nr4a2b-p2a-dTomato)] egr3−/− larvae at 72 hpf. (G) Quantification of EdCs present in the AV canal ECM of control and nr4a2b-overexpressing egr3−/− larvae at 72 hpf; n = 16 and 15 larvae; two independent experiments. (C), (E), and (G) Student’s t test, mean ± SEM. Scale bars, 20 μm.
|