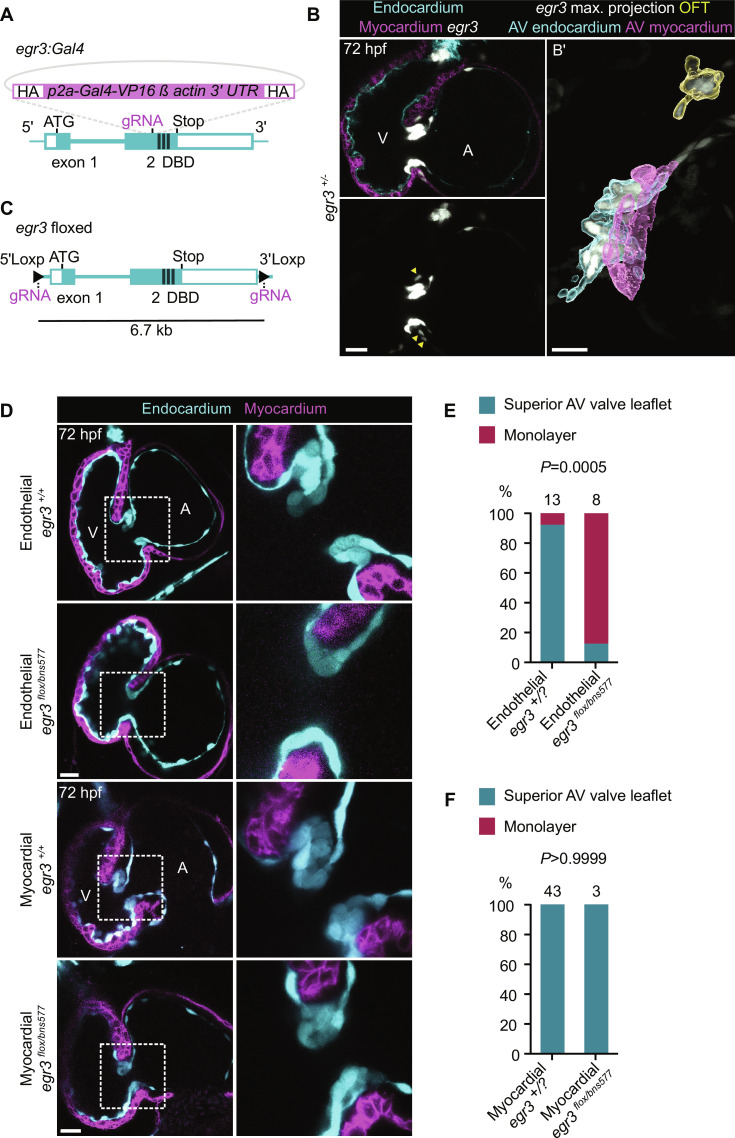
IMAGE

Fig. 2.

ID
ZDB-IMAGE-240518-18
Source
Figures for da Silva et al., 2024
Image
Figure Caption

Fig. 2. Endothelial-specific deletion of egr3 recapitulates the global mutant phenotype

(A) Schematic of the knock-in reporter [Pt(egr3:Gal4-VP16)] generated by inserting Gal4-VP16 in exon 2 of egr3. (B) Pt(egr3:Gal4-VP16); Tg(UAS:eGFP) expression (gray) at 72 hpf; EdCs are marked by Tg(kdrl:Hsa.HRAS-mCherry) expression (cyan) and myocardial cells by Tg(myl7:BFP-CAAX) expression (magenta); yellow arrowheads point to AV canal egr3 reporter+ cardiomyocytes. (B′) Maximum projection of Pt(egr3:Gal4-VP16); Tg(UAS:eGFP) expression with image segmentation of egr3 reporter+ AV canal EdCs (cyan), egr3 reporter+ AV canal myocardial cells (magenta), and egr3 reporter+ OFT cells (yellow). (C) Schematic of egr3 floxed allele Pt(egr3:loxP-egr3-loxP). (D) Confocal images of representative hearts from 72 hpf egr3+/+, endothelial cell–specific egr3−/−, and myocardial cell–specific egr3−/− larvae using the egr3 floxed allele line. (E and F) Percentage of 72 hpf egr3+/?, endothelial cell–specific egr3−/− (E), and myocardial cell–specific egr3−/− (F) larvae with a superior valve leaflet and without a superior valve leaflet (i.e., endocardial monolayer); one and two independent experiments, respectively; Fisher’s exact test. Scale bars, 20 μm.

Acknowledgments
This image is the copyrighted work of the attributed author or publisher, and ZFIN has permission only to display this image to its users. Additional permissions should be obtained from the applicable author or publisher of the image. Full text @ Sci Adv