
- Title
-
Therapeutic antibody engineering for efficient targeted degradation of membrane proteins in lysosomes
- Authors
- Gauthier, C., Daurat, M., Ali, L.M.A., El Cheikh, K., El Bahlagui, I., Taliercio, C., Morère, E., Gary-Bobo, M., Morère, A., Garcia, M., Maynadier, M., Basile, I.
- Source
- Full text @ Biomed. Pharmacother.
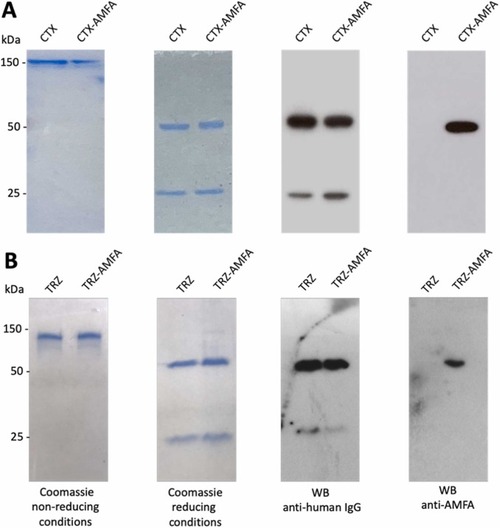
Characterization of CTX and TRZ grafted with AMFA. SDS-PAGE detection of CTX (A) and TRZ (B) before and after AMFA grafting. Non-reducing and reducing SDS-PAGE analyses followed either by Coomassie blue staining of the antibodies or by Western blotting using anti-human IgG or anti-AMFA antibodies. |
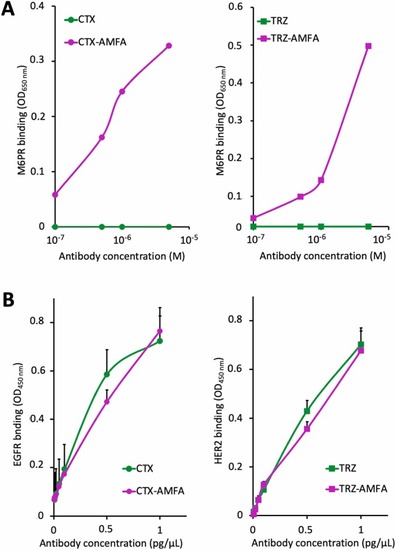
Binding affinity of CTX-AMFA and TRZ-AMFA for M6PR and their target. (A) Binding affinity for M6PR. The affinity of CTX or CTX-AMFA (left) and TRZ or TRZ-AMFA (right) for M6PR was determined by ELISA. Results are presented as the absorbance of mAb or mAb-AMFA bound to M6PR and detected with HRP-conjugated anti-human IgG antibody. Non-specific adsorption values of the antibodies bound to uncoated wells are subtracted. (B) Antigen affinity. The affinity of CTX or CTX-AMFA (left) and TRZ or TRZ-AMFA (right) for EGFR and HER2, respectively, was determined by ELISA. Results are presented as the absorbance of mAb or mAb-AMFA detected by HRP-conjugated anti-human IgG antibody (mean ± SEM from triplicates). |
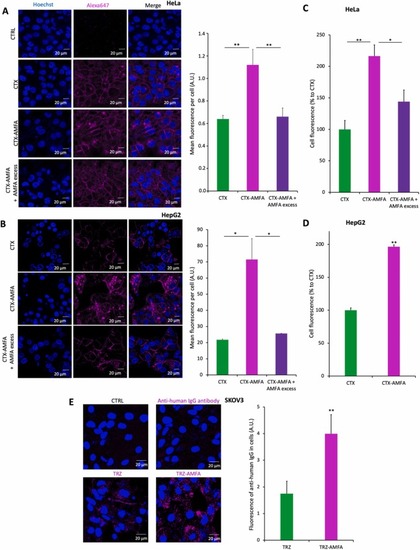
Internalization of mAb and mAb-AMFA into cells. (A-B) Internalization of CTX or CTX-AMFA by confocal microscopy. HeLa cells (A) or HepG2 cells (B) were treated for 5 h with 5 nM CTX or CTX-AMFA which were detected with 2.5 nM anti-human IgG antibody coupled to AlexaFluor647Ⓡ. A·20 mM AMFA excess was used to prevent the cell uptake mediated by M6PR. Results are presented as the mean fluorescence ± SEM per cell determined in 30 cells. (C-D). Internalization of CTX and CTX-AMFA by flow cytometry. HeLa (C) and HepG2 cells (D) were treated with 5 nM CTX or CTX-AMFA labeled with AlexaFluor488Ⓡ for 5 h. An excess of 20 mM AMFA was used to inhibit CTX-AMFA cell uptake mediated by M6PR. Data are expressed as the percentage ± SEM of cell fluorescence compared to CTX (n=2). (E) Internalization of TRZ and TRZ-AMFA by confocal microscopy. SKOV3 cells were treated with 5 nM TRZ or TRZ-AMFA and with 2.5 nM anti-human IgG antibody coupled with AlexaFluor647Ⓡ for 24 h. Microscopy was performed on living cells and data are expressed as the mean fluorescence ± SD of antibody per cell quantified in 60 cells. Tukey’s test was performed for multiple comparisons. Student’s t-test was performed for paired analysis: * p value < 0.05; ** p value < 0.01. |
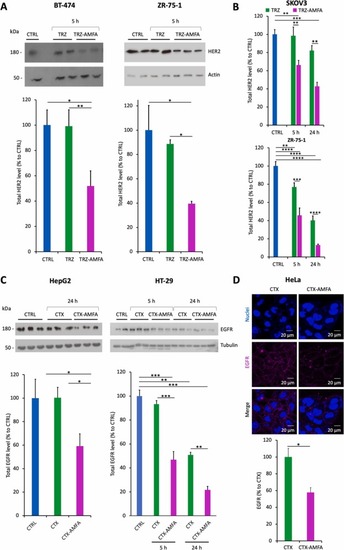
Degradation of HER2 and EGFR proteins. (A) HER2 degradation analysis in BT-474 and ZR-75–1 cells at 5 h by Western blot. Cells were treated with 5 nM TRZ or TRZ-AMFA for 5 h (n=2) and analyzed by Western blot. (B) HER2 degradation at 5 h and 24 h in SKOV3 and ZR-75–1 cells. Cells were treated with 5 nM TRZ or TRZ-AMFA for 5 h or 24 h and HER2 levels were determined by ELISA (n=2). (C) EGFR degradation in HepG2 (left) or HT-29 cells (right). Cells were treated with 10 nM CTX or CTX-AMFA for 5 h or 24 h. One representative experiment out of two is shown. For Fig. A-C, membrane receptor levels were quantified and expressed as the percentage ± SEM of total HER2 or EGFR levels in control cells, accordingly. (D) EGFR membrane detection by confocal microscopy. HeLa cells were treated with 10 nM CTX or CTX-AMFA for 24 h and EGFR was detected with an anti-EGFR antibody together with a secondary antibody coupled with AlexaFluor647®. Microscopy was performed on living cells and EGFR quantification is presented as the mean fluorescence ± SEM of antibody per cell determined in 40 cells. Statistical analysis was performed with Tukey’s multiple comparison test and Student’s t-test:* p value < 0.05; ** p value < 0.01; *** p value < 0.001; **** p value < 0.0001. |
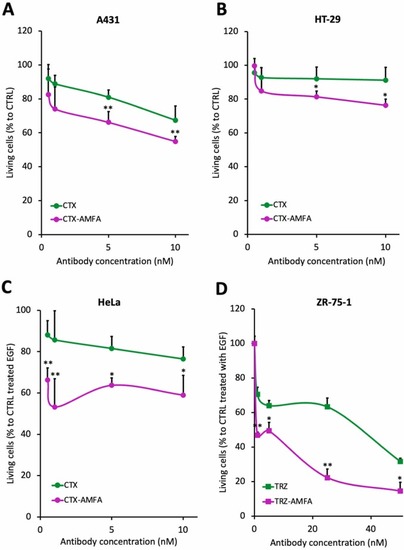
Antiproliferative effect of mAb and mAb-AMFA. Antiproliferative effect of CTX and CTX-AMFA in A431 (A) and HT-29 (B) cells. A431 and HT-29 cells were treated with 0.5–10 nM CTX or CTX-AMFA for 48 h and cell proliferation was analyzed by MTT assay. Results are presented as the percentage ± SD of living cells compared to control (n=2). (C) Antiproliferative effect of CTX and CTX-AMFA in the presence of EGF. HeLa cells were treated with 0.5–10 nM CTX or CTX-AMFA in the presence of 200 ng/mL EGF for 48 h (n=3). (D) Antiproliferative effect of TRZ or TRZ-AMFA in the presence of EGF. ZR-75–1 cells were treated with 1–50 nM TRZ or TRZ-AMFA in the presence of 200 ng/mL EGF for 72 h (n=2). Cell proliferation was analyzed by MTT assay. Data are expressed as the percentage ± SD of living cells relatively to control cells treated with EGF. Student’s t-test: * p value < 0.05; ** p value < 0.01. |
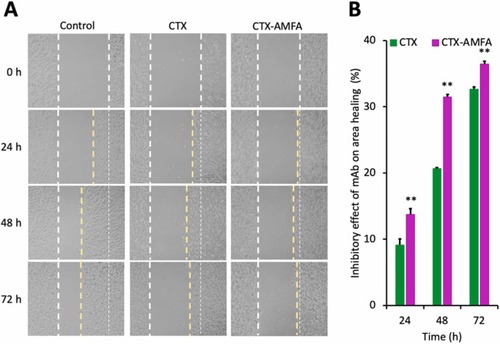
Increased anti-migration and anti-proliferative effects of CTX-AMFA. HaCaT cells were treated with 10 nM CTX or CTX-AMFA for 72 h. A wound healing test was realized and the scratch area was monitored at 24, 48 and 72 h to assess the cell migration and proliferation. (A) Wound healing test at 0 h, 24 h, 48 h and 72 h after treatment. (B) Increment in the free area by CTX and CTX-AMFA. Free areas were quantified at different time points and compared to the area at time 0 h. Results are presented as the percentage of the free area variation in mAb treated cells over time compared to the free area variation in untreated control cells. Mean ± SD. Student’s t-test: ** p value < 0.01. |
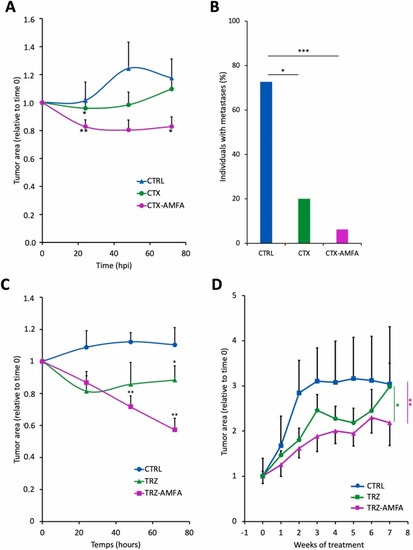
Growth inhibition of xenografted tumors by mAb and mAb-AMFA in zebrafish embryos and mice. (A) Tumor growth inhibition in casper zebrafish xenografted embryos treated with CTX or CTX-AMFA. Embryos were xenografted with human HT-29 cells and intravenously injected with 5 ng of CTX (n=15) or CTX-AMFA (n=16) or 5 % glucose solution for CTRL group (n=11) and were monitored for 72 hpi. Data represent tumor growth rate ± SEM over time. One-way ANOVA Tukey’s test was realized for statistical analysis. At 24 h, CTRL/CTX-AMFA p value < 0.01, CTRL/CTX p value < 0.05; at 72 h CTRL/CTX-AMFA p value < 0.05 (B) Metastasis development. Data represent the percentage of untreated or CTX or CTX-AMFA treated embroys presenting at least one metastasis at 72 hpi. Fisher’s exact test was performed for statistical analysis. (C) Tumor growth inhibition in casper zebrafish xenografted embryos treated with TRZ or TRZ-AMFA. Embryos were xenografted with human SKOV3 cells and intravenously injected with 3.6 ng TRZ (n=9) or TRZ-AMFA (n=9) or 5 % glucose solution for control (CTRL, n=7) and were monitored for 72 hpi. Data represent the tumor growth rate ± SEM over time. One-way ANOVA Tukey’s test was realized for statistical analysis. At 48 h CTRL/TRZ-AMFA p value < 0.01, at 72 h CTRL/TRZ-AMFA p value < 0.01 and TRZ/TRZ-AMFA p value < 0.05 (D). Tumor growth inhibition in xenografted mice treated with TRZ and TRZ-AMFA. BALB/c nudenu/nu female mice were xenografted with human SKOV3 cells and received 8 weekly injections of 6 mg/kg TRZ (n=6) or TRZ-AMFA (n=6) or PBS for control mice (CTRL; n=4). Data represent the mean ± SEM of tumor area relative to time 0 over treatment weeks. Mixed effect analysis model together with Tukey’s test was performed for statistical analysis to compare treatment curves. CTRL/TRZ-AMFA p <0.01, TRZ/TRZ-AMFA p <0.05. * p value < 0.05; ** p value < 0.01; *** p value < 0.001. |